
Hello,
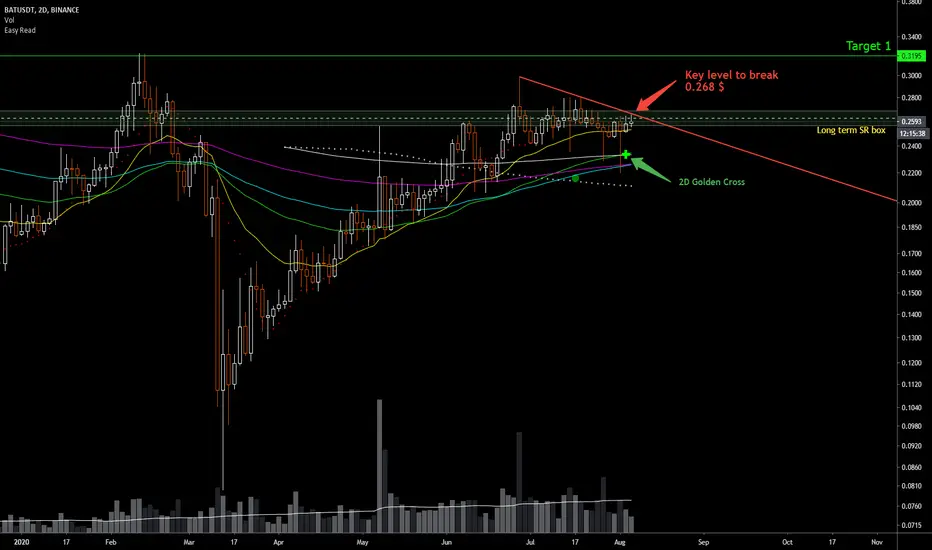
Here we have 2D chart for BAT, we now have confirmed 2D golden cross and BAT is approaching key long term SR levels. I would like to see a clean break above 0.268$ level and then we can head for two key targets on the upside.

If we see BAT break above 0.44$ then it will be in a blue sky break out and can reach higher level with strong FOMO kicking in. But for now I am going step-by-step :)
Happy and safe trading...
chao...
Here we have 2D chart for BAT, we now have confirmed 2D golden cross and BAT is approaching key long term SR levels. I would like to see a clean break above 0.268$ level and then we can head for two key targets on the upside.
If we see BAT break above 0.44$ then it will be in a blue sky break out and can reach higher level with strong FOMO kicking in. But for now I am going step-by-step :)
Happy and safe trading...
chao...

면책사항
해당 정보와 게시물은 금융, 투자, 트레이딩 또는 기타 유형의 조언이나 권장 사항으로 간주되지 않으며, 트레이딩뷰에서 제공하거나 보증하는 것이 아닙니다. 자세한 내용은 이용 약관을 참조하세요.
면책사항
해당 정보와 게시물은 금융, 투자, 트레이딩 또는 기타 유형의 조언이나 권장 사항으로 간주되지 않으며, 트레이딩뷰에서 제공하거나 보증하는 것이 아닙니다. 자세한 내용은 이용 약관을 참조하세요.