업데이트됨
BBIG Informative
$NASDAQ:BBIG
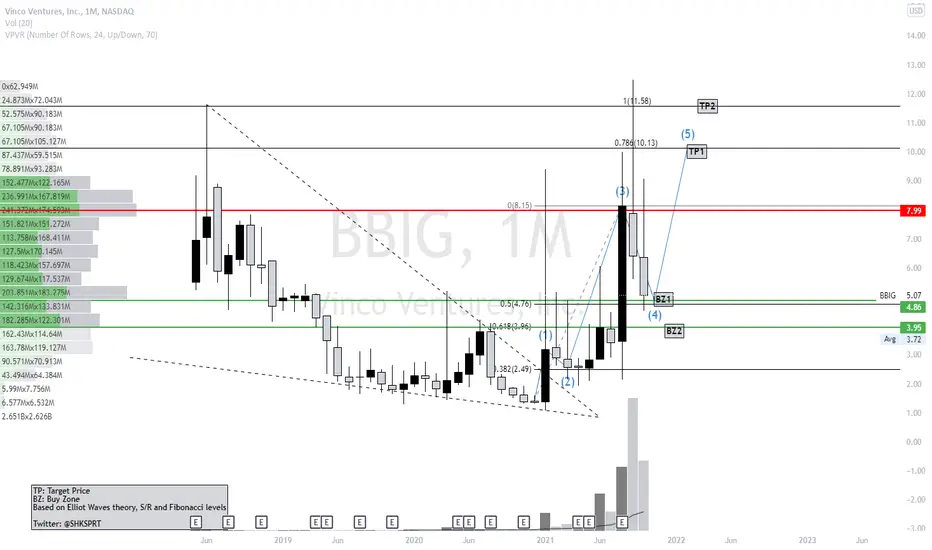
Monthly chart analysis based on Elliot waves, in theory it could reach to 3.90$ area, but personally I don't think so, It should have a reversal now, price target is between 10-12
* This is my idea and could be wrong 100%
Monthly chart analysis based on Elliot waves, in theory it could reach to 3.90$ area, but personally I don't think so, It should have a reversal now, price target is between 10-12
* This is my idea and could be wrong 100%
노트
we reached to floor, very close to my price, last session AH price action was a good signal of reversal, we are at 4.28$ before ER day. if ER be bullish then we can expect wave 5, I see 20$ or even higher price possibility. In Aug 2021, it went from 2$ to 12$. it's very possible that we see same price action again.
GL

no pain, no gain
Unveiling illusions, revealing wealth
Unveiling illusions, revealing wealth
면책사항
해당 정보와 게시물은 금융, 투자, 트레이딩 또는 기타 유형의 조언이나 권장 사항으로 간주되지 않으며, 트레이딩뷰에서 제공하거나 보증하는 것이 아닙니다. 자세한 내용은 이용 약관을 참조하세요.
no pain, no gain
Unveiling illusions, revealing wealth
Unveiling illusions, revealing wealth
면책사항
해당 정보와 게시물은 금융, 투자, 트레이딩 또는 기타 유형의 조언이나 권장 사항으로 간주되지 않으며, 트레이딩뷰에서 제공하거나 보증하는 것이 아닙니다. 자세한 내용은 이용 약관을 참조하세요.