
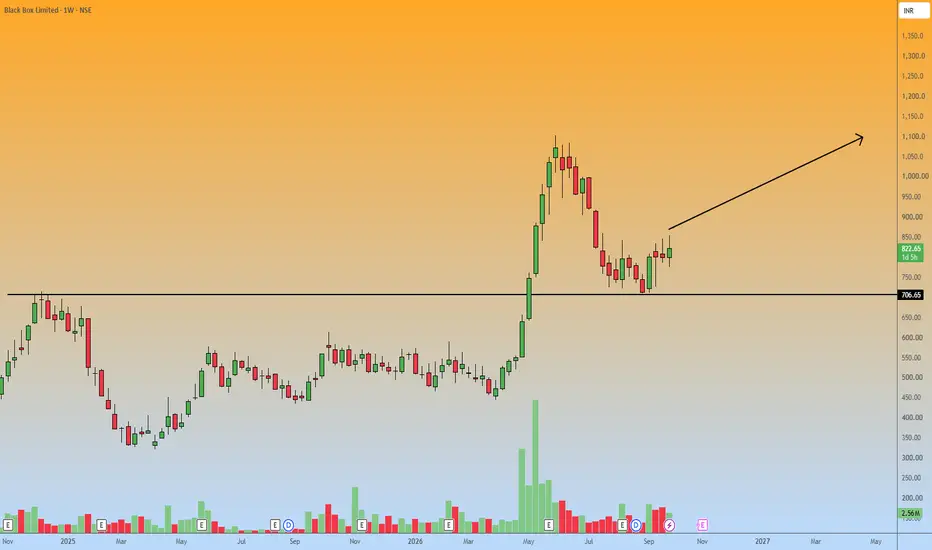
The weekly chart for Black Box Limited reveals a clear technical setup following a textbook retest of historical structure.
After a massive volume-backed rally that peaked near the 1,100 mark, the stock underwent a natural retracement.
It has now successfully pulled back to a critical horizontal support zone at exactly 706.65.
The recent price action shows a strong bullish bounce off this 706.65 level, indicating that buyers are aggressively defending this previous breakout area.
With the asset currently trading around 823.00, this structural retest provides a solid foundation for a long position, adhering to the guideline of explaining the core reasoning behind the analysis.
Bias: Long
Entry Point: Consider an initial entry near the current market price of 823.00, while looking to accumulate on any minor pullbacks into the 780–810 zone to optimize the risk-to-reward ratio.
Target: The primary upside target is a retest of the previous major swing high near 1,100.
A secondary, more conservative target can be placed at the intermediate resistance around 950.
Stop Loss: A strict stop loss should be placed below the primary 706.65 support line.
A weekly close below 680 would break the market structure and immediately invalidate this bullish thesis.
After a massive volume-backed rally that peaked near the 1,100 mark, the stock underwent a natural retracement.
It has now successfully pulled back to a critical horizontal support zone at exactly 706.65.
The recent price action shows a strong bullish bounce off this 706.65 level, indicating that buyers are aggressively defending this previous breakout area.
With the asset currently trading around 823.00, this structural retest provides a solid foundation for a long position, adhering to the guideline of explaining the core reasoning behind the analysis.
Bias: Long
Entry Point: Consider an initial entry near the current market price of 823.00, while looking to accumulate on any minor pullbacks into the 780–810 zone to optimize the risk-to-reward ratio.
Target: The primary upside target is a retest of the previous major swing high near 1,100.
A secondary, more conservative target can be placed at the intermediate resistance around 950.
Stop Loss: A strict stop loss should be placed below the primary 706.65 support line.
A weekly close below 680 would break the market structure and immediately invalidate this bullish thesis.

면책사항
해당 정보와 게시물은 금융, 투자, 트레이딩 또는 기타 유형의 조언이나 권장 사항으로 간주되지 않으며, 트레이딩뷰에서 제공하거나 보증하는 것이 아닙니다. 자세한 내용은 이용 약관을 참조하세요.
면책사항
해당 정보와 게시물은 금융, 투자, 트레이딩 또는 기타 유형의 조언이나 권장 사항으로 간주되지 않으며, 트레이딩뷰에서 제공하거나 보증하는 것이 아닙니다. 자세한 내용은 이용 약관을 참조하세요.