
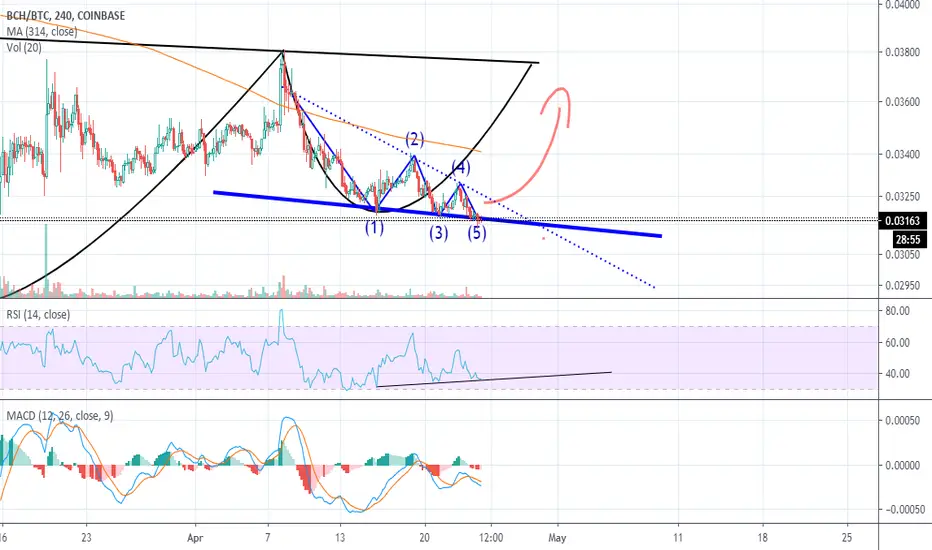
It looks like bch has completed a falling wedge pattern, which is often bullish.
The pattern is interesting because there is triple bullish divergence on the RSI, the price in satoshi is dropping, but the momentum isn't following to the downside. A bounce could be incoming. This combined with the btc halving could see bch propel higher.
IF it breaks the dotted line (resistance line), then it's highly likely that bch will complete the inverse head and shoulders reversal pattern.
The same structure can be observed in other coins as well, such as ETC.
As usual the post is for educational purpose only. :)

면책사항
해당 정보와 게시물은 금융, 투자, 트레이딩 또는 기타 유형의 조언이나 권장 사항으로 간주되지 않으며, 트레이딩뷰에서 제공하거나 보증하는 것이 아닙니다. 자세한 내용은 이용 약관을 참조하세요.
면책사항
해당 정보와 게시물은 금융, 투자, 트레이딩 또는 기타 유형의 조언이나 권장 사항으로 간주되지 않으며, 트레이딩뷰에서 제공하거나 보증하는 것이 아닙니다. 자세한 내용은 이용 약관을 참조하세요.