
Bloom Energy Corporation is showing a powerful weekly breakout after a long base and a strong accumulation phase.
This is the kind of chart that can keep running when the market starts to price in real growth, clean trend structure, and a fresh narrative.
Price has already moved aggressively, but the structure is still intact and the current pullback looks more like a retest than a failure.
The bigger picture is simple. BE has gone from a quiet low priced base into a much higher valuation zone because the market is accepting the story.
That matters in momentum names because once a weekly breakout is confirmed, traders and funds often keep bidding the dips as long as the structure holds. This chart is still in that phase, which is why the current setup remains attractive.
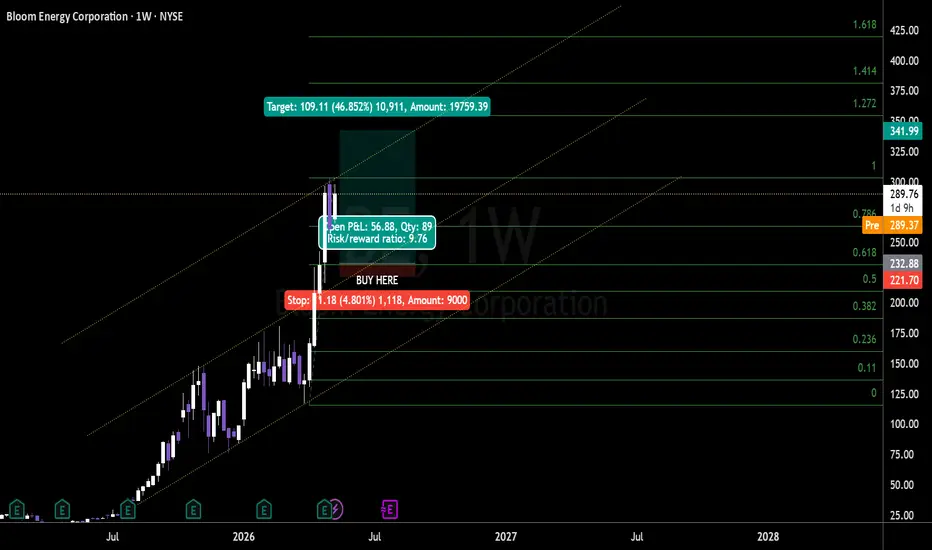
Technically, price has moved up inside a strong rising channel and is now sitting above the breakout area. The entry sits at 232.88 dollars, which is the key retest and breakout confirmation zone. The stop at 221.70 keeps the trade defined, while the target at 341.99 gives the move room to continue back into the upper trend channel.
🟢 Buy Zone 1 (232.88 dollars)
Price is holding above the breakout zone and has pulled back into the first major support area after a vertical expansion. This is the kind of weekly retest traders look for when momentum has already been confirmed. The risk is controlled and the upside remains large if the trend continues.
Entry: 232.88 dollars
Current Price: 289.76 dollars
Stop: 221.70 dollars
Target: 341.99 dollars
Qty: 89 shares
Risk/Reward Ratio: 9.76
Position Size: 9,000 dollars
Potential P&L: 19,759.39 dollars
Risk per Share: 11.18 dollars
Reward per Share: 109.11 dollars
Key Levels:
🔑 Buy Price: 232.88 dollars
🔑 Current Price: 289.76 dollars
🔑 Stop: 221.70 dollars
🔑 Target: 341.99 dollars
🔑 Breakout Support: 232.88 dollars
🔑 Current Retest Zone: 232.88 dollars
🔑 Upper Target Zone: 341.99 dollars
🔑 Trend Context: weekly breakout inside a rising channel
🎯 Primary Target: 341.99 dollars, or about plus 46.852 percent from entry
⚠️ Hard Stop: 221.70 dollars
This is the kind of chart that traders want when they are looking for continuation after a strong breakout. The trade is only valid while the stock keeps respecting the breakout area and the rising channel. If that support fails, the idea loses strength quickly and the move risks turning into a failed breakout instead of a continuation.
If you found this analysis useful, hit the Follow button at the top of the page and drop a like on this idea so it reaches more traders. I am updating these breakout and continuation setups in real time across miners, energy, chips, defense, crypto, and AI infrastructure. You do not want to miss what comes next.
⚠️ Not financial advice. Manage your risk.
This is the kind of chart that can keep running when the market starts to price in real growth, clean trend structure, and a fresh narrative.
Price has already moved aggressively, but the structure is still intact and the current pullback looks more like a retest than a failure.
The bigger picture is simple. BE has gone from a quiet low priced base into a much higher valuation zone because the market is accepting the story.
That matters in momentum names because once a weekly breakout is confirmed, traders and funds often keep bidding the dips as long as the structure holds. This chart is still in that phase, which is why the current setup remains attractive.
Technically, price has moved up inside a strong rising channel and is now sitting above the breakout area. The entry sits at 232.88 dollars, which is the key retest and breakout confirmation zone. The stop at 221.70 keeps the trade defined, while the target at 341.99 gives the move room to continue back into the upper trend channel.
🟢 Buy Zone 1 (232.88 dollars)
Price is holding above the breakout zone and has pulled back into the first major support area after a vertical expansion. This is the kind of weekly retest traders look for when momentum has already been confirmed. The risk is controlled and the upside remains large if the trend continues.
Entry: 232.88 dollars
Current Price: 289.76 dollars
Stop: 221.70 dollars
Target: 341.99 dollars
Qty: 89 shares
Risk/Reward Ratio: 9.76
Position Size: 9,000 dollars
Potential P&L: 19,759.39 dollars
Risk per Share: 11.18 dollars
Reward per Share: 109.11 dollars
Key Levels:
🔑 Buy Price: 232.88 dollars
🔑 Current Price: 289.76 dollars
🔑 Stop: 221.70 dollars
🔑 Target: 341.99 dollars
🔑 Breakout Support: 232.88 dollars
🔑 Current Retest Zone: 232.88 dollars
🔑 Upper Target Zone: 341.99 dollars
🔑 Trend Context: weekly breakout inside a rising channel
🎯 Primary Target: 341.99 dollars, or about plus 46.852 percent from entry
⚠️ Hard Stop: 221.70 dollars
This is the kind of chart that traders want when they are looking for continuation after a strong breakout. The trade is only valid while the stock keeps respecting the breakout area and the rising channel. If that support fails, the idea loses strength quickly and the move risks turning into a failed breakout instead of a continuation.
If you found this analysis useful, hit the Follow button at the top of the page and drop a like on this idea so it reaches more traders. I am updating these breakout and continuation setups in real time across miners, energy, chips, defense, crypto, and AI infrastructure. You do not want to miss what comes next.
⚠️ Not financial advice. Manage your risk.

면책사항
해당 정보와 게시물은 금융, 투자, 트레이딩 또는 기타 유형의 조언이나 권장 사항으로 간주되지 않으며, 트레이딩뷰에서 제공하거나 보증하는 것이 아닙니다. 자세한 내용은 이용 약관을 참조하세요.
면책사항
해당 정보와 게시물은 금융, 투자, 트레이딩 또는 기타 유형의 조언이나 권장 사항으로 간주되지 않으며, 트레이딩뷰에서 제공하거나 보증하는 것이 아닙니다. 자세한 내용은 이용 약관을 참조하세요.