
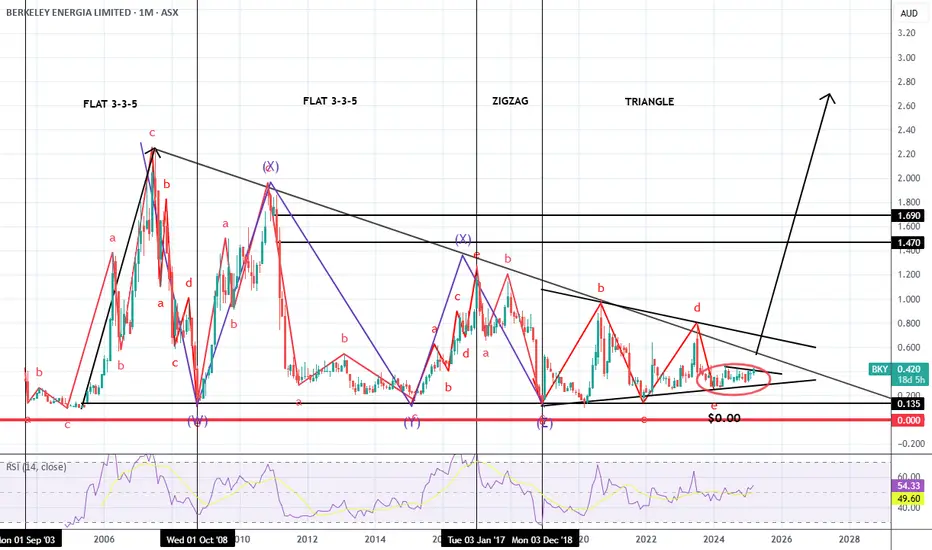
BKY Monthly chart
Elliot wave corrective patterns and Large triangle, added Triangle base target estimate to possible breakout area
Likely $2.70, currently $0.425 = 630% or 6.3 reward to risk if you are willing to keep it to $0.00
Not making money but very experienced and qualified management team developing its spanish mine,
BKY has a current ratio of 31x which suggests it has large reserves circa ~$75mil as of Early 2025 suggesting it has a large reserve to convert assets into production
Elliot wave corrective patterns and Large triangle, added Triangle base target estimate to possible breakout area
Likely $2.70, currently $0.425 = 630% or 6.3 reward to risk if you are willing to keep it to $0.00
Not making money but very experienced and qualified management team developing its spanish mine,
BKY has a current ratio of 31x which suggests it has large reserves circa ~$75mil as of Early 2025 suggesting it has a large reserve to convert assets into production
노트
As an alternative theory, There is a potential for this to be a small triangle for a further move down to $0.13This would represent a triangle throwover and if there are buying signs on lower timeframes would offer a lower risk opportunity to buy
Timing is not critical for me as this is a multi year trade but interesting structure to see as 20year triangles are not very common
액티브 트레이드
Breakout to upside, already at $0.545 and likely to continue climbing, likely the start of a large move given the consolidation below and relatively tight price actionWould not be surprised to large upward moves ahead, but I never buy on large bars

면책사항
해당 정보와 게시물은 금융, 투자, 트레이딩 또는 기타 유형의 조언이나 권장 사항으로 간주되지 않으며, 트레이딩뷰에서 제공하거나 보증하는 것이 아닙니다. 자세한 내용은 이용 약관을 참조하세요.
면책사항
해당 정보와 게시물은 금융, 투자, 트레이딩 또는 기타 유형의 조언이나 권장 사항으로 간주되지 않으며, 트레이딩뷰에서 제공하거나 보증하는 것이 아닙니다. 자세한 내용은 이용 약관을 참조하세요.