
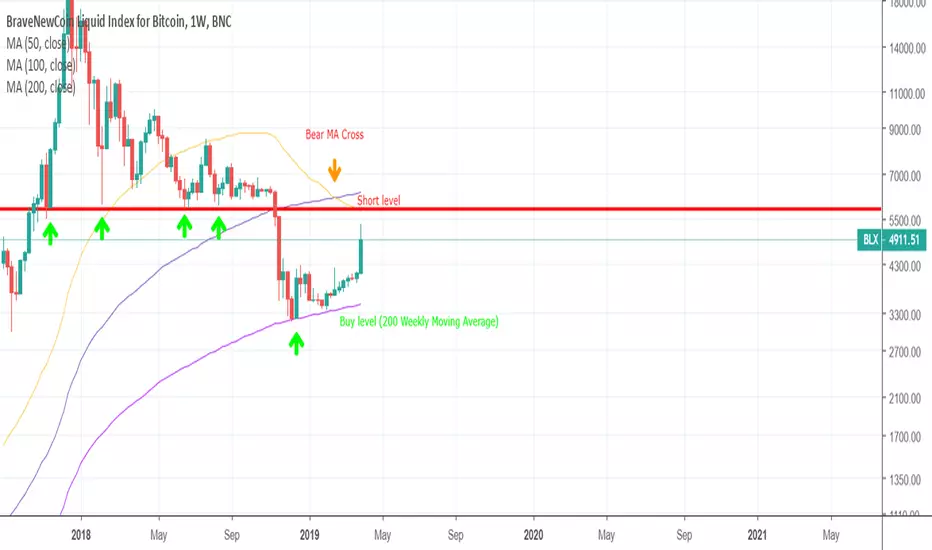
This is the Bitcoin weekly view (BLX chart).
We have seen that the 5800$ level acted as a good support until it was tested for the 5th time in november 2018. Now it is acting as huge resistance and it coincides with the 50 Weekly Moving Average, which also acts a resistance. Furthermore we have seen the bearish MA cross happen already (50 crossed down the 100). The long term support is at the 200 weekly Moving Average.
We have seen that the 5800$ level acted as a good support until it was tested for the 5th time in november 2018. Now it is acting as huge resistance and it coincides with the 50 Weekly Moving Average, which also acts a resistance. Furthermore we have seen the bearish MA cross happen already (50 crossed down the 100). The long term support is at the 200 weekly Moving Average.

면책사항
해당 정보와 게시물은 금융, 투자, 트레이딩 또는 기타 유형의 조언이나 권장 사항으로 간주되지 않으며, 트레이딩뷰에서 제공하거나 보증하는 것이 아닙니다. 자세한 내용은 이용 약관을 참조하세요.
면책사항
해당 정보와 게시물은 금융, 투자, 트레이딩 또는 기타 유형의 조언이나 권장 사항으로 간주되지 않으며, 트레이딩뷰에서 제공하거나 보증하는 것이 아닙니다. 자세한 내용은 이용 약관을 참조하세요.