
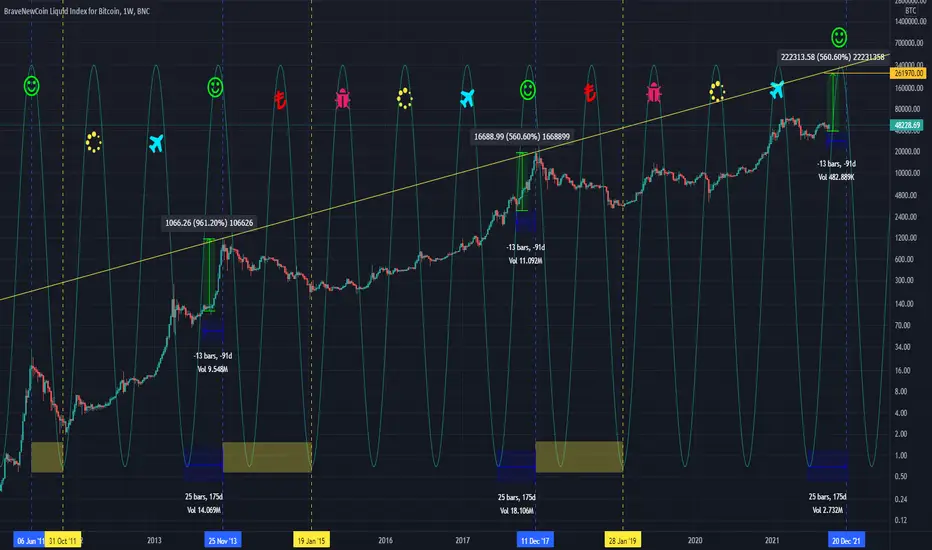
A sine wave is a geometric waveform that oscillates periodically, and is defined by the function y = sin x.
The sine wave indicator is based on the assumption that markets move in cyclical patterns. After quantifying a cycle, a trader may try to use the pattern to develop a leading indicator. This works extremely well when the market is indeed moving in a cycle.
The sine wave as a technical chart analysis tool is based on advanced mathematics and is designed to indicate whether a market is trending or in a cycle mode. It helps traders identify the start and finish of a trending move as well as possible shifts in the trend.
The sine wave indicator is based on the assumption that markets move in cyclical patterns. After quantifying a cycle, a trader may try to use the pattern to develop a leading indicator. This works extremely well when the market is indeed moving in a cycle.
The sine wave as a technical chart analysis tool is based on advanced mathematics and is designed to indicate whether a market is trending or in a cycle mode. It helps traders identify the start and finish of a trending move as well as possible shifts in the trend.

관련 발행물
면책사항
해당 정보와 게시물은 금융, 투자, 트레이딩 또는 기타 유형의 조언이나 권장 사항으로 간주되지 않으며, 트레이딩뷰에서 제공하거나 보증하는 것이 아닙니다. 자세한 내용은 이용 약관을 참조하세요.
면책사항
해당 정보와 게시물은 금융, 투자, 트레이딩 또는 기타 유형의 조언이나 권장 사항으로 간주되지 않으며, 트레이딩뷰에서 제공하거나 보증하는 것이 아닙니다. 자세한 내용은 이용 약관을 참조하세요.