
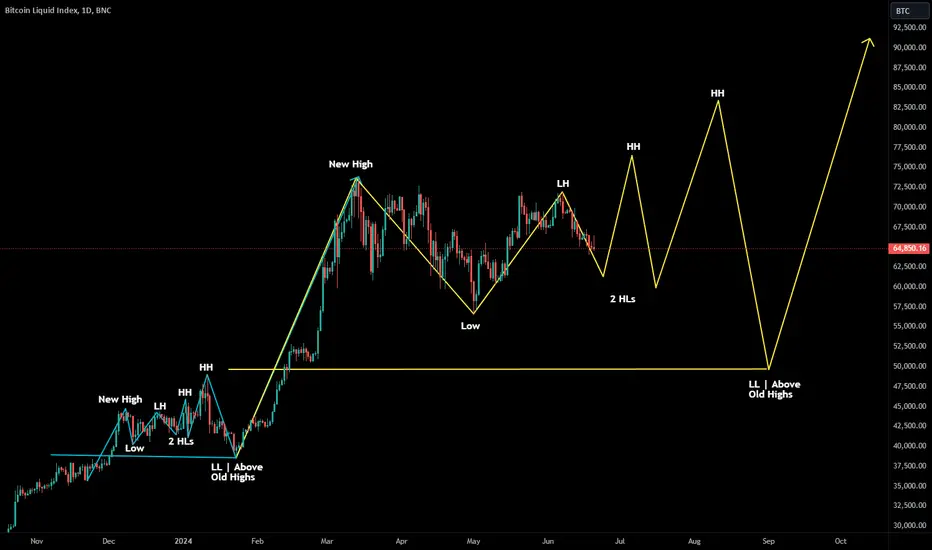
Here's an idea I haven't seen proposed. What if we're repeating the same pattern we saw between approx 40-50k, on a higher timeframe and between 50-85k.
Just like the blue pattern before it, it starts with a new high being made, then a low well above old highs, then a lower high followed by a higher low, then a higher high followed by a 2nd higher low (slightly lower than the previous higher low), finally a 3rd and significantly higher high followed be a strong lower low but still above old highs prior to the new high.
Let's see if it happens again!
Just like the blue pattern before it, it starts with a new high being made, then a low well above old highs, then a lower high followed by a higher low, then a higher high followed by a 2nd higher low (slightly lower than the previous higher low), finally a 3rd and significantly higher high followed be a strong lower low but still above old highs prior to the new high.
Let's see if it happens again!

면책사항
해당 정보와 게시물은 금융, 투자, 트레이딩 또는 기타 유형의 조언이나 권장 사항으로 간주되지 않으며, 트레이딩뷰에서 제공하거나 보증하는 것이 아닙니다. 자세한 내용은 이용 약관을 참조하세요.
면책사항
해당 정보와 게시물은 금융, 투자, 트레이딩 또는 기타 유형의 조언이나 권장 사항으로 간주되지 않으며, 트레이딩뷰에서 제공하거나 보증하는 것이 아닙니다. 자세한 내용은 이용 약관을 참조하세요.