
Just a little update of my last idea, about some confluence with previous waves.
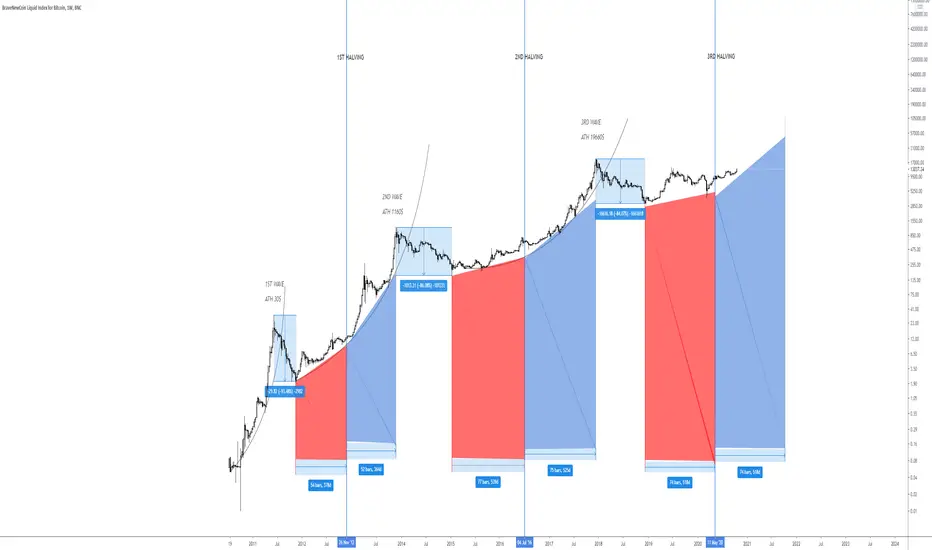
- There is a clear symmetry from the minimum to the maximum of each cycle. There is approx. the same distance from the minimum to the halving, than from the halving to the next ATH . In first case 54 and 52 weeks, and second 77 and 75, with just 2 weeks of difference in both cases.
- Once crossing the previous ATH until reaching the new one, there are 36 and 39 weeks in both cycles.
So with this in mind, and with my previous idea I still think that we are at the start of a bullish trend long term market, one year aehad where almost all cryptomarket will PUMP crazy, amd that will probably see the peak at the end of 2021. Will see how it plays.
- There is a clear symmetry from the minimum to the maximum of each cycle. There is approx. the same distance from the minimum to the halving, than from the halving to the next ATH . In first case 54 and 52 weeks, and second 77 and 75, with just 2 weeks of difference in both cases.
- Once crossing the previous ATH until reaching the new one, there are 36 and 39 weeks in both cycles.
So with this in mind, and with my previous idea I still think that we are at the start of a bullish trend long term market, one year aehad where almost all cryptomarket will PUMP crazy, amd that will probably see the peak at the end of 2021. Will see how it plays.
노트
노트
In confluence with the last ideaPD- SORRY FOR THE SHITTY QUALITY OF THE CHART GUYS, BUT TRADINGVIEW DESTROYS ANY CHART ABOVE 1080P. YOU CAN SEE IT PROPERLY ON THE PICS.
CHEERS

관련 발행물
면책사항
해당 정보와 게시물은 금융, 투자, 트레이딩 또는 기타 유형의 조언이나 권장 사항으로 간주되지 않으며, 트레이딩뷰에서 제공하거나 보증하는 것이 아닙니다. 자세한 내용은 이용 약관을 참조하세요.
관련 발행물
면책사항
해당 정보와 게시물은 금융, 투자, 트레이딩 또는 기타 유형의 조언이나 권장 사항으로 간주되지 않으며, 트레이딩뷰에서 제공하거나 보증하는 것이 아닙니다. 자세한 내용은 이용 약관을 참조하세요.