
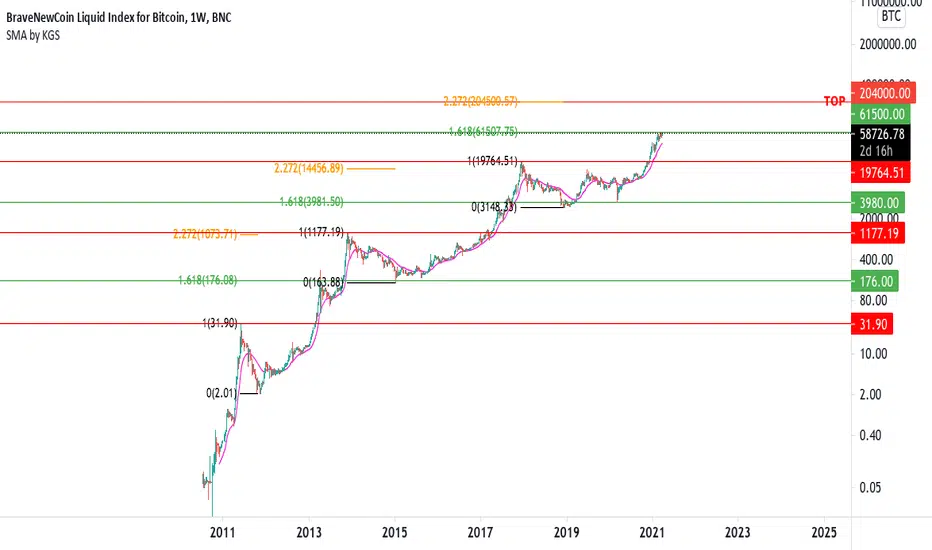
As you can see, there is a pattern of tops and bottoms on BTC if we look on the logarithmic scale with fibonacci settings also on log. If this patterns continues we gonna have the next top on 200.000 area and the next bottom to 60.000 area. We have no reason to believe this pattern is broken so let’s see if and when we go there.

면책사항
해당 정보와 게시물은 금융, 투자, 트레이딩 또는 기타 유형의 조언이나 권장 사항으로 간주되지 않으며, 트레이딩뷰에서 제공하거나 보증하는 것이 아닙니다. 자세한 내용은 이용 약관을 참조하세요.
면책사항
해당 정보와 게시물은 금융, 투자, 트레이딩 또는 기타 유형의 조언이나 권장 사항으로 간주되지 않으며, 트레이딩뷰에서 제공하거나 보증하는 것이 아닙니다. 자세한 내용은 이용 약관을 참조하세요.