
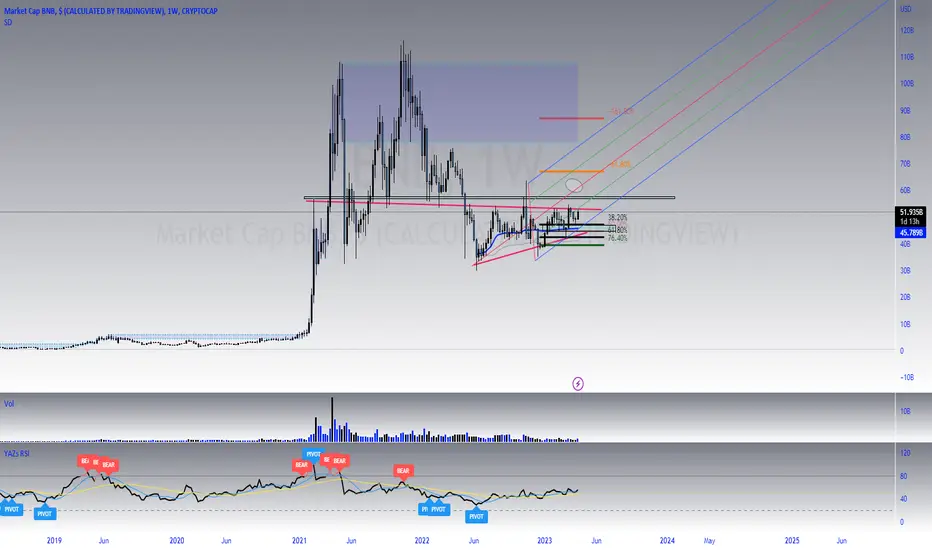
On the chart we can see a symmetrical triangle pattern, which is a neutral pattern meaning that it can breakout either to the upside or to the downside.
Enter the trade once the price breaks out of the triangle.
Look at the volume surge in order to avoid the false breakout.
Targets for long and for short are shown on the chart.
Enter the trade once the price breaks out of the triangle.
Look at the volume surge in order to avoid the false breakout.
Targets for long and for short are shown on the chart.

면책사항
해당 정보와 게시물은 금융, 투자, 트레이딩 또는 기타 유형의 조언이나 권장 사항으로 간주되지 않으며, 트레이딩뷰에서 제공하거나 보증하는 것이 아닙니다. 자세한 내용은 이용 약관을 참조하세요.
면책사항
해당 정보와 게시물은 금융, 투자, 트레이딩 또는 기타 유형의 조언이나 권장 사항으로 간주되지 않으며, 트레이딩뷰에서 제공하거나 보증하는 것이 아닙니다. 자세한 내용은 이용 약관을 참조하세요.