
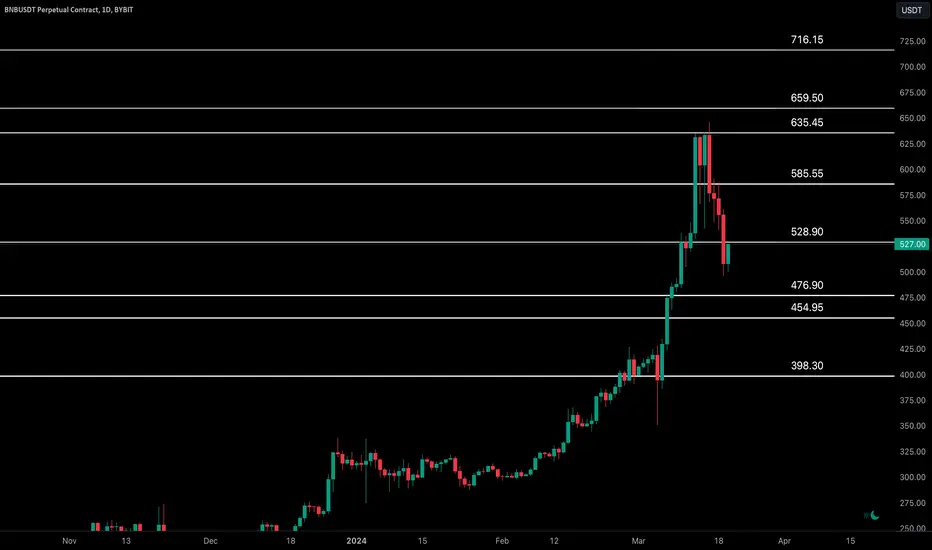
Binancecoin declined from the key resistance zone of $635-$660.
A sustained price action below $529 will push #BNB price lower to $455-$477.
A daily candle closure above the key daily resistance zone of $635-$660 is required for another bullish extension towards $716, the new ATH.
Intraday Chart

The BNBUSDT intraday chart is in the bearish territory below $548.
A re-test of the resistance zone of $463-$487 and a bullish rejection will lead to a bullish rally to $548.
A solid bullish break-out of $548 will push price higher towards $600.
A bearish break-out of $463-$487 will lead to a dip towards $407-$433 and, possibly lower.
A sustained price action below $529 will push #BNB price lower to $455-$477.
A daily candle closure above the key daily resistance zone of $635-$660 is required for another bullish extension towards $716, the new ATH.
Intraday Chart
The BNBUSDT intraday chart is in the bearish territory below $548.
A re-test of the resistance zone of $463-$487 and a bullish rejection will lead to a bullish rally to $548.
A solid bullish break-out of $548 will push price higher towards $600.
A bearish break-out of $463-$487 will lead to a dip towards $407-$433 and, possibly lower.

Check out the daily market updates on youtube.com/@TradeLeanCom
관련 발행물
면책사항
해당 정보와 게시물은 금융, 투자, 트레이딩 또는 기타 유형의 조언이나 권장 사항으로 간주되지 않으며, 트레이딩뷰에서 제공하거나 보증하는 것이 아닙니다. 자세한 내용은 이용 약관을 참조하세요.
Check out the daily market updates on youtube.com/@TradeLeanCom
관련 발행물
면책사항
해당 정보와 게시물은 금융, 투자, 트레이딩 또는 기타 유형의 조언이나 권장 사항으로 간주되지 않으며, 트레이딩뷰에서 제공하거나 보증하는 것이 아닙니다. 자세한 내용은 이용 약관을 참조하세요.