
Hi!
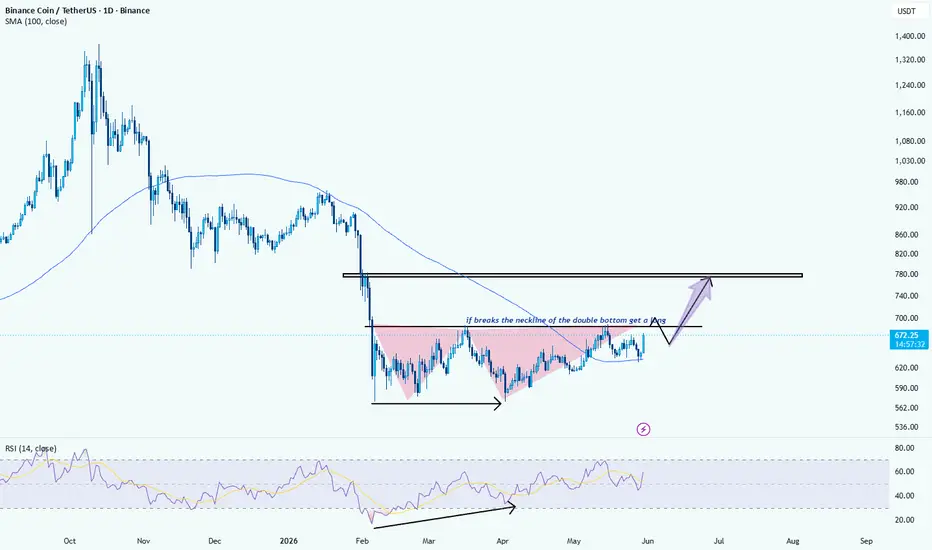
BNB is showing a strong bullish recovery after carving out a clear double bottom formation on the daily chart, a pattern often associated with trend reversals and the start of a new upward leg.
The market has already reclaimed the 100-day SMA and is now pressing against the neckline resistance around $680–$690, the most important level on the chart. A decisive breakout above this zone would confirm the pattern and signal a shift in long-term momentum back in favor of the bulls.
Adding to the bullish case, RSI continues to print higher lows, highlighting strengthening momentum and growing buyer participation despite recent consolidation.
Trading Plan:
A daily close above the neckline would provide confirmation of the double bottom breakout. The higher-probability approach is to wait for a retest of the breakout zone before looking for long opportunities.
🎯 Bullish Targets:
First target: $780
Extended target: Higher levels if momentum accelerates after confirmation
As long as BNB remains above the recent higher lows, the bullish structure stays intact. The neckline is now the gatekeeper to a potentially explosive move higher. 🔥
BNB is showing a strong bullish recovery after carving out a clear double bottom formation on the daily chart, a pattern often associated with trend reversals and the start of a new upward leg.
The market has already reclaimed the 100-day SMA and is now pressing against the neckline resistance around $680–$690, the most important level on the chart. A decisive breakout above this zone would confirm the pattern and signal a shift in long-term momentum back in favor of the bulls.
Adding to the bullish case, RSI continues to print higher lows, highlighting strengthening momentum and growing buyer participation despite recent consolidation.
Trading Plan:
A daily close above the neckline would provide confirmation of the double bottom breakout. The higher-probability approach is to wait for a retest of the breakout zone before looking for long opportunities.
🎯 Bullish Targets:
First target: $780
Extended target: Higher levels if momentum accelerates after confirmation
As long as BNB remains above the recent higher lows, the bullish structure stays intact. The neckline is now the gatekeeper to a potentially explosive move higher. 🔥

📊 AVATrade Ambassador Join & explore:
avatrade.com/trading-account?p=Webtrader&tag=220256
-----------------
🟢 Telegram channel: t.me/melikatrader94
🔴 Forex channel: t.me/melikatrader94GoldForex
avatrade.com/trading-account?p=Webtrader&tag=220256
-----------------
🟢 Telegram channel: t.me/melikatrader94
🔴 Forex channel: t.me/melikatrader94GoldForex
면책사항
해당 정보와 게시물은 금융, 투자, 트레이딩 또는 기타 유형의 조언이나 권장 사항으로 간주되지 않으며, 트레이딩뷰에서 제공하거나 보증하는 것이 아닙니다. 자세한 내용은 이용 약관을 참조하세요.
📊 AVATrade Ambassador Join & explore:
avatrade.com/trading-account?p=Webtrader&tag=220256
-----------------
🟢 Telegram channel: t.me/melikatrader94
🔴 Forex channel: t.me/melikatrader94GoldForex
avatrade.com/trading-account?p=Webtrader&tag=220256
-----------------
🟢 Telegram channel: t.me/melikatrader94
🔴 Forex channel: t.me/melikatrader94GoldForex
면책사항
해당 정보와 게시물은 금융, 투자, 트레이딩 또는 기타 유형의 조언이나 권장 사항으로 간주되지 않으며, 트레이딩뷰에서 제공하거나 보증하는 것이 아닙니다. 자세한 내용은 이용 약관을 참조하세요.