
🔎 Current situation
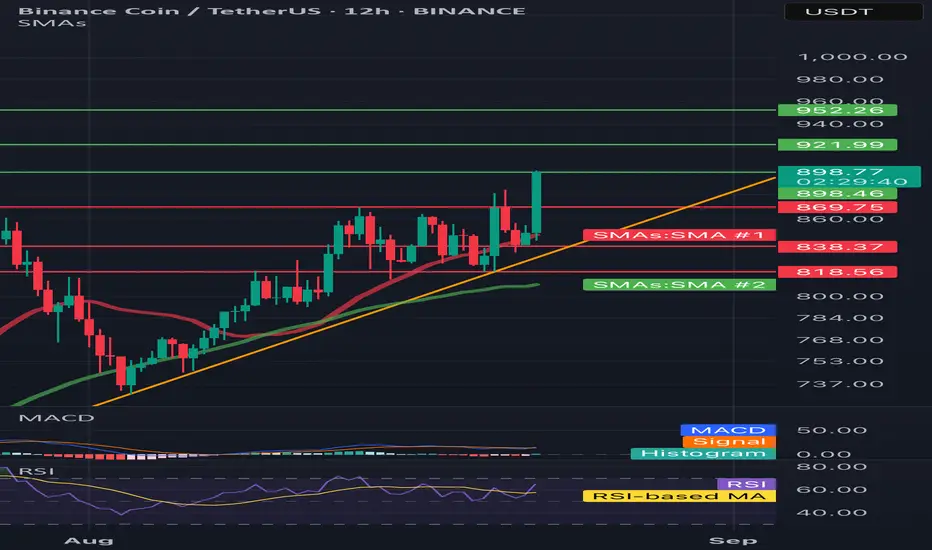
• Price: 898.50 USDT (+7.03%) - outstanding candle.
• Trend: We see a strong growth impulse, confirmed by the reflection from the trend line (yellow).
• Support:
• 869.75 USDT (next short -term support).
• 838.37 USDT.
• 818.56 USDT (SMA #2).
• resistance:
• 921.99 USDT.
• 952.26 USDT (key level - potential target, can be tested).
⸻
📊 Indicators
• SMA (movable average):
• The price struck over SMA and lasts above-a pro-rectification signal.
• MacD:
• The MacD line pierces the signal line from the bottom → fresh buy signal.
• The histogram begins to grow green.
• RSI (Relative Strength Index):
• Currently ~ 60 → a lot of space for the purchase zone (70+).
• RSI directed up, confirms the momentum of bulls.
⸻
📈 Scenarios
1. Bycza (more likely short -term)
• If the price lasts above 869–870 USDT → attack on 922 USDT.
• Breaking 922 with a strong volume → Another target 950–960 USDT.
2. Bear (less likely now but possible)
• Rejection from 922 and descent below 870 USDT → withdrawal to 838 or even 818 USDT.
• Only the loss of 818 will negate the current upward trend.
⸻
📝 Summary
BNB currently looks very strong - a fresh growth impulse, breaking over medium, MacD gives a buy signal, RSI is not yet in the purchase zone.
➡️ If something negative on BTC or the wide market does not happen, then the 922 and 952 test is real in the short term.
• Price: 898.50 USDT (+7.03%) - outstanding candle.
• Trend: We see a strong growth impulse, confirmed by the reflection from the trend line (yellow).
• Support:
• 869.75 USDT (next short -term support).
• 838.37 USDT.
• 818.56 USDT (SMA #2).
• resistance:
• 921.99 USDT.
• 952.26 USDT (key level - potential target, can be tested).
⸻
📊 Indicators
• SMA (movable average):
• The price struck over SMA and lasts above-a pro-rectification signal.
• MacD:
• The MacD line pierces the signal line from the bottom → fresh buy signal.
• The histogram begins to grow green.
• RSI (Relative Strength Index):
• Currently ~ 60 → a lot of space for the purchase zone (70+).
• RSI directed up, confirms the momentum of bulls.
⸻
📈 Scenarios
1. Bycza (more likely short -term)
• If the price lasts above 869–870 USDT → attack on 922 USDT.
• Breaking 922 with a strong volume → Another target 950–960 USDT.
2. Bear (less likely now but possible)
• Rejection from 922 and descent below 870 USDT → withdrawal to 838 or even 818 USDT.
• Only the loss of 818 will negate the current upward trend.
⸻
📝 Summary
BNB currently looks very strong - a fresh growth impulse, breaking over medium, MacD gives a buy signal, RSI is not yet in the purchase zone.
➡️ If something negative on BTC or the wide market does not happen, then the 922 and 952 test is real in the short term.

면책사항
해당 정보와 게시물은 금융, 투자, 트레이딩 또는 기타 유형의 조언이나 권장 사항으로 간주되지 않으며, 트레이딩뷰에서 제공하거나 보증하는 것이 아닙니다. 자세한 내용은 이용 약관을 참조하세요.
면책사항
해당 정보와 게시물은 금융, 투자, 트레이딩 또는 기타 유형의 조언이나 권장 사항으로 간주되지 않으며, 트레이딩뷰에서 제공하거나 보증하는 것이 아닙니다. 자세한 내용은 이용 약관을 참조하세요.