
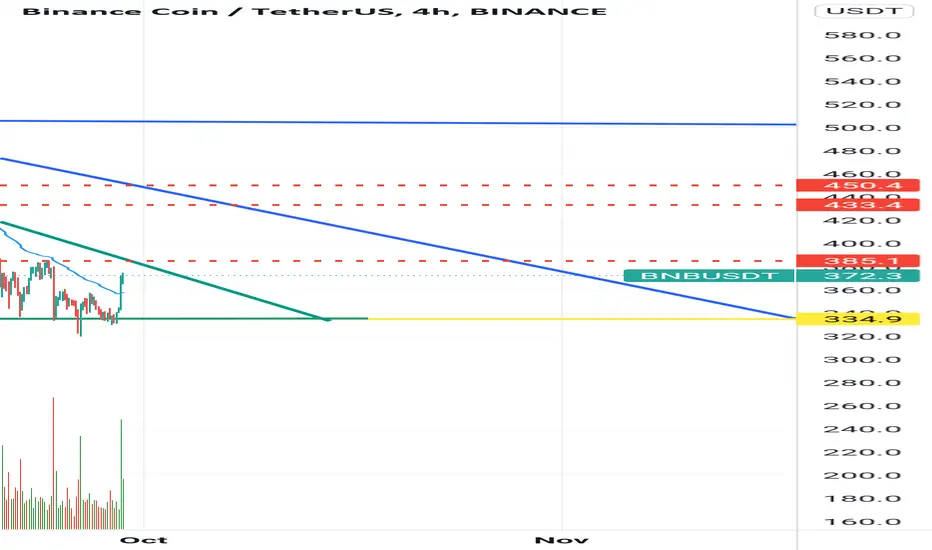
Well it's my prediction for bnb...at the first look, it might be hard to understand😁 but it's not, well at first you should know reds are resistance and are our targets and yellows are our supports....you see green triangle that price stuck on it, the best place for buy bnb is when price crosses top of triangle and a candle close there or down of the triangle in the green area.. When price cross up it reachs to red areas and you can sell there🙃 also our final target is dynamic blue trend line that has strong resistance....in the end you see 500 dollars blue line, it means that when price cross up there it could reach to the moon🌚 unfortunately the price recently has not stabilized above that and dumped from there, if it happens again you should consider selling near 500.
Thanks for watching 🙏❤❤
Thanks for watching 🙏❤❤

면책사항
해당 정보와 게시물은 금융, 투자, 트레이딩 또는 기타 유형의 조언이나 권장 사항으로 간주되지 않으며, 트레이딩뷰에서 제공하거나 보증하는 것이 아닙니다. 자세한 내용은 이용 약관을 참조하세요.
면책사항
해당 정보와 게시물은 금융, 투자, 트레이딩 또는 기타 유형의 조언이나 권장 사항으로 간주되지 않으며, 트레이딩뷰에서 제공하거나 보증하는 것이 아닙니다. 자세한 내용은 이용 약관을 참조하세요.