
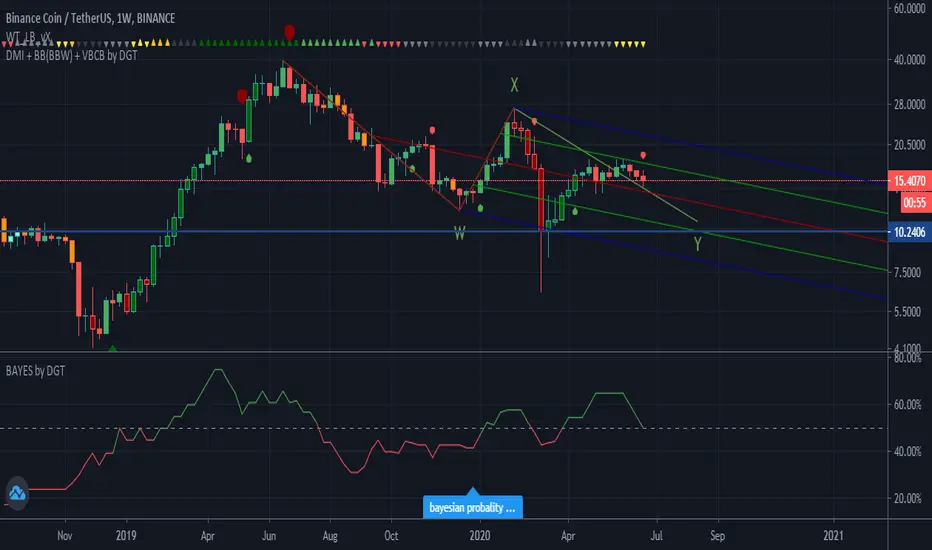
Short indication 1 : colored directional movment index on the top of the chart is yelow which indicates non-existend trend and the arrow points down which is showing that the negative direction is stronger.
Short indication 2 : probability line as shown with bayes indicator is right at %50 level which is infact equilibrium of probable move up or down. But the slope is pointing down which could be indication of further move down. PS: Probablity line is calculated by taking on account BTCUSDT’s probable movements
Short indication 3 : WaveTrend is signaling sell even if it is not a strong one
Short indication 4 : Price Action below 20 period SMA
Short indication 5 : elliott wave could be forming WXY and Y not completed yet
Short indication 2 : probability line as shown with bayes indicator is right at %50 level which is infact equilibrium of probable move up or down. But the slope is pointing down which could be indication of further move down. PS: Probablity line is calculated by taking on account BTCUSDT’s probable movements
Short indication 3 : WaveTrend is signaling sell even if it is not a strong one
Short indication 4 : Price Action below 20 period SMA
Short indication 5 : elliott wave could be forming WXY and Y not completed yet

SoleMare Analytics | MarketMastery™ Tools | Exclusively on TradingView
면책사항
해당 정보와 게시물은 금융, 투자, 트레이딩 또는 기타 유형의 조언이나 권장 사항으로 간주되지 않으며, 트레이딩뷰에서 제공하거나 보증하는 것이 아닙니다. 자세한 내용은 이용 약관을 참조하세요.
면책사항
해당 정보와 게시물은 금융, 투자, 트레이딩 또는 기타 유형의 조언이나 권장 사항으로 간주되지 않으며, 트레이딩뷰에서 제공하거나 보증하는 것이 아닙니다. 자세한 내용은 이용 약관을 참조하세요.