
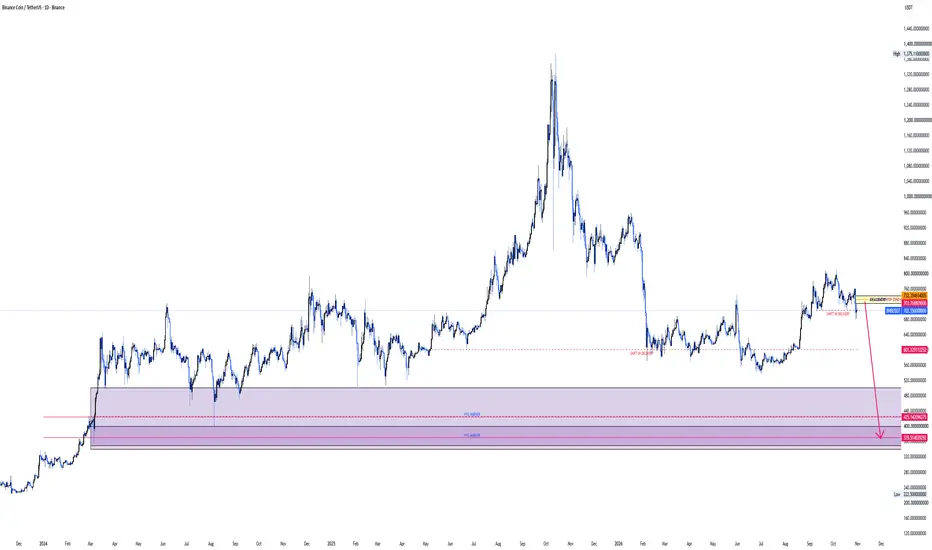
On the 12 month chart, price is yet to contact the imbalance at 425 indicating a possibility of a bearish price correction. On the 6 month chart, an additional imbalance is identified at 370 price handle.
On the monthly chart, we have a shift in market structure from bullish to bearish confirming possibility of price pushing lower to clear the market imbalance mentioned earlier. The daily chart further confirms a shift in market structure as price is expected to push lower. Our sell limit is placed at 732.4, our exit is either the medium term target at 425.15 or long term target at 370.51.
On the monthly chart, we have a shift in market structure from bullish to bearish confirming possibility of price pushing lower to clear the market imbalance mentioned earlier. The daily chart further confirms a shift in market structure as price is expected to push lower. Our sell limit is placed at 732.4, our exit is either the medium term target at 425.15 or long term target at 370.51.

Join my private groups [ Forex swing/position market calls] &[ Buy and Hold Crypto market calls]
afroswing.gumroad.com/
afroswing.gumroad.com/
관련 발행물
면책사항
해당 정보와 게시물은 금융, 투자, 트레이딩 또는 기타 유형의 조언이나 권장 사항으로 간주되지 않으며, 트레이딩뷰에서 제공하거나 보증하는 것이 아닙니다. 자세한 내용은 이용 약관을 참조하세요.
Join my private groups [ Forex swing/position market calls] &[ Buy and Hold Crypto market calls]
afroswing.gumroad.com/
afroswing.gumroad.com/
관련 발행물
면책사항
해당 정보와 게시물은 금융, 투자, 트레이딩 또는 기타 유형의 조언이나 권장 사항으로 간주되지 않으며, 트레이딩뷰에서 제공하거나 보증하는 것이 아닙니다. 자세한 내용은 이용 약관을 참조하세요.