
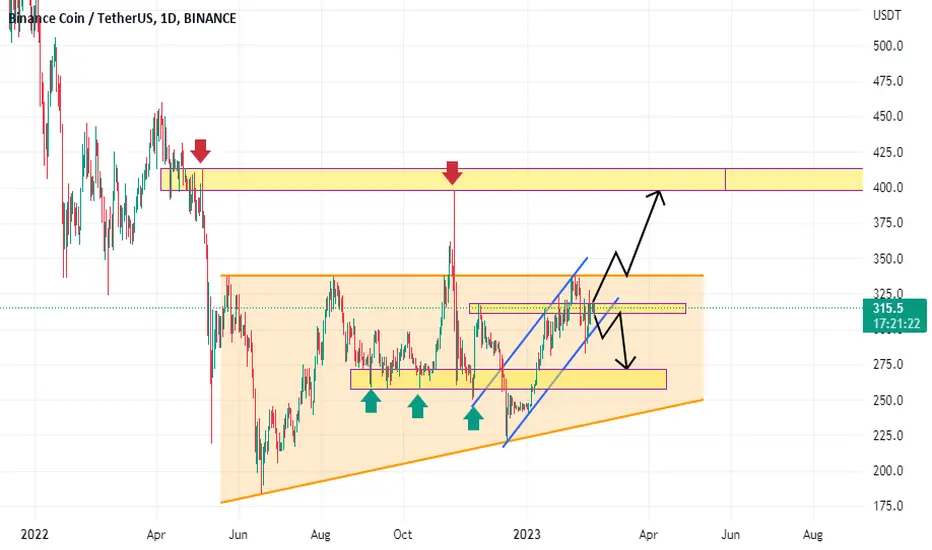
Hello traders, we want to check the BNBUSDT chart on the daily time frame. The price is moving in an ascending channel within a range zone. If the price can maintain its upward trend and break the key level of 340, expect price growth. We have the next target, which is the price of 400. But if it cannot maintain itself in the upward channel and break the channel downward, it will probably drop to around the price of 270. Good luck.

면책사항
해당 정보와 게시물은 금융, 투자, 트레이딩 또는 기타 유형의 조언이나 권장 사항으로 간주되지 않으며, 트레이딩뷰에서 제공하거나 보증하는 것이 아닙니다. 자세한 내용은 이용 약관을 참조하세요.
면책사항
해당 정보와 게시물은 금융, 투자, 트레이딩 또는 기타 유형의 조언이나 권장 사항으로 간주되지 않으며, 트레이딩뷰에서 제공하거나 보증하는 것이 아닙니다. 자세한 내용은 이용 약관을 참조하세요.