
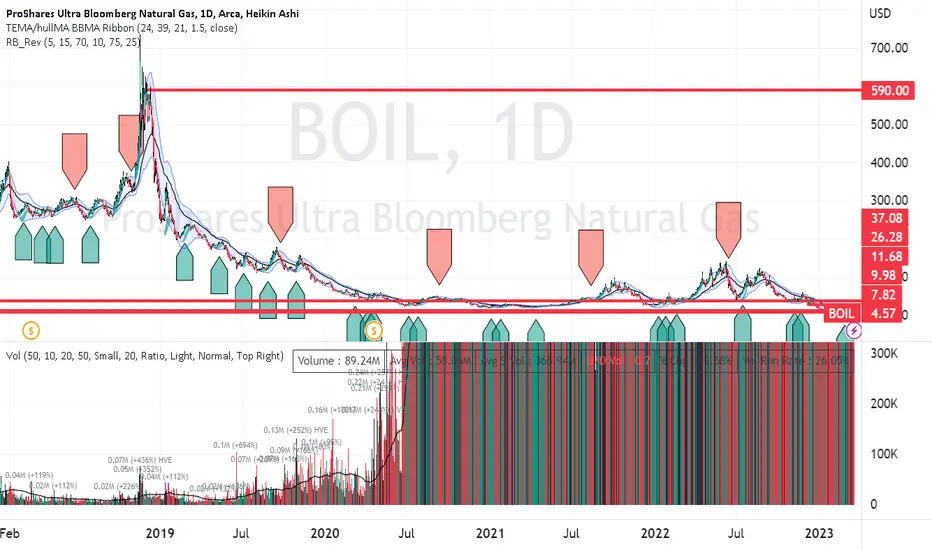
On the daily chart, BOIL price has never been lower and the relative volume has never
been higher in the past five years. Being mindful, this is leveraged it falls faster than an
the unleveraged counterpart of the same commodity ( UNG INL) However moves in the
opposite directions are also amplified. Horizontal red lines are drawn in consideration
of pivots on the 4H. Price was nearly $600 in 2019. Can you think of a fundamental
reason why price cannot rise from the present price to something closer to that
of 2019. To go from $4 to $600 is 150X in otherwords 15000%. Is there anything
wrong with my math or the chart?
been higher in the past five years. Being mindful, this is leveraged it falls faster than an
the unleveraged counterpart of the same commodity ( UNG INL) However moves in the
opposite directions are also amplified. Horizontal red lines are drawn in consideration
of pivots on the 4H. Price was nearly $600 in 2019. Can you think of a fundamental
reason why price cannot rise from the present price to something closer to that
of 2019. To go from $4 to $600 is 150X in otherwords 15000%. Is there anything
wrong with my math or the chart?
액티브 트레이드
For a math exercise, suppose an equity price increases 2% per trading day and then compounds for 125 trading days or six months. What is the resulting total value of return given for instance $100 in initial shares? The answer might surprise you depending on how mathematically astute you might be.액티브 트레이드
Just got a pop from the fed news of a rate hike.
면책사항
해당 정보와 게시물은 금융, 투자, 트레이딩 또는 기타 유형의 조언이나 권장 사항으로 간주되지 않으며, 트레이딩뷰에서 제공하거나 보증하는 것이 아닙니다. 자세한 내용은 이용 약관을 참조하세요.
면책사항
해당 정보와 게시물은 금융, 투자, 트레이딩 또는 기타 유형의 조언이나 권장 사항으로 간주되지 않으며, 트레이딩뷰에서 제공하거나 보증하는 것이 아닙니다. 자세한 내용은 이용 약관을 참조하세요.