
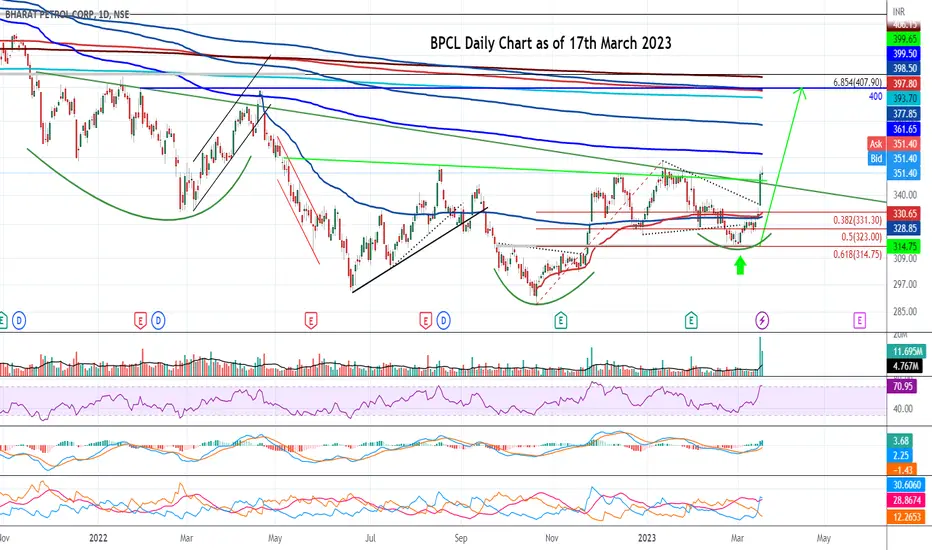
Attached: Daily Chart as of 17th March, 2023
- Price shot up a whooping 6.24% on 16th March (Thursday) and also held the Gains closing Higher on Friday
- Overall giving a Strong Weekly Breakout Candle closing above the 350 key level
- 315 level or the 0.618 Fib retracement held out perfectly as a support🙏
Indicator Signals:
- MACD crossed above 0 line ✅
- RSI crossed above 70 ✅
- DMI gave Buy signal ✅
- ADX is above 25 ✅
- An Inverse Head & Shoulder Pattern is currently active given the Breakout Candle📈
Upside Potential:
A Short Term Target 🎯 of ~ 400 is now Open
Stop Loss for the same is < 325

Siddharth Bhansali
✔️Twitter Handle @T_Harth
✔️Twitter Handle @T_Harth
면책사항
해당 정보와 게시물은 금융, 투자, 트레이딩 또는 기타 유형의 조언이나 권장 사항으로 간주되지 않으며, 트레이딩뷰에서 제공하거나 보증하는 것이 아닙니다. 자세한 내용은 이용 약관을 참조하세요.
Siddharth Bhansali
✔️Twitter Handle @T_Harth
✔️Twitter Handle @T_Harth
면책사항
해당 정보와 게시물은 금융, 투자, 트레이딩 또는 기타 유형의 조언이나 권장 사항으로 간주되지 않으며, 트레이딩뷰에서 제공하거나 보증하는 것이 아닙니다. 자세한 내용은 이용 약관을 참조하세요.