
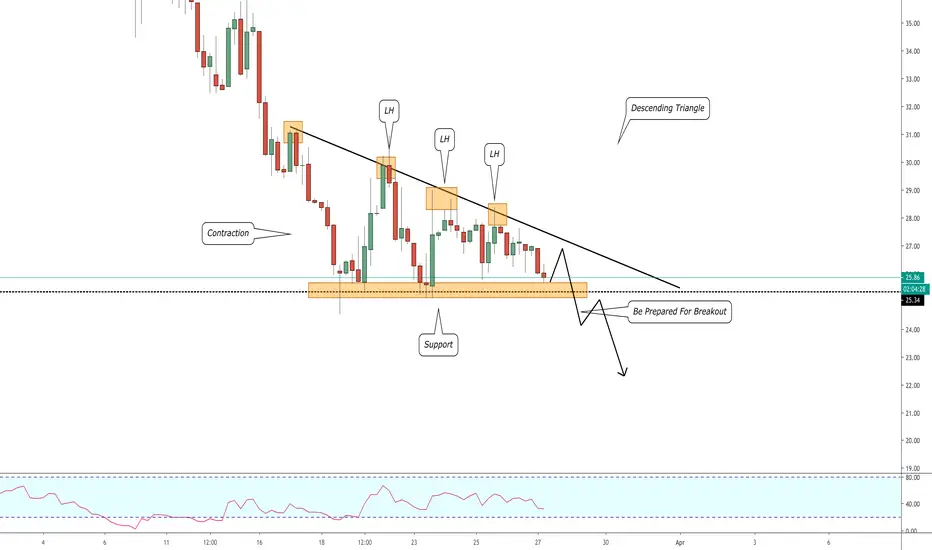
long period of contraction on brent oil.
with a sequence of lower highs and long term bearish trend, the chances are high that market participants are preparing for the next wave to the downside.
pay attention to the underlined horizontal support and sell its bearish breakout!
what is the target? I don't know! No structure on the left! Let's see together :)
p.s trading triangles, a preferable stop is above the last lower high!
please, support the idea with like! thank you!

✅My Telegram Channel: t.me/VasilyTrading
❗️YouTube Channel: youtube.com/c/VasilyTrader
✅ Facebook: facebook.com/VasilyTrading/
⭐ Get 100% Deposit Bonus: bit.ly/bestforexgoldbroker
❗️YouTube Channel: youtube.com/c/VasilyTrader
✅ Facebook: facebook.com/VasilyTrading/
⭐ Get 100% Deposit Bonus: bit.ly/bestforexgoldbroker
관련 발행물
면책사항
해당 정보와 게시물은 금융, 투자, 트레이딩 또는 기타 유형의 조언이나 권장 사항으로 간주되지 않으며, 트레이딩뷰에서 제공하거나 보증하는 것이 아닙니다. 자세한 내용은 이용 약관을 참조하세요.
✅My Telegram Channel: t.me/VasilyTrading
❗️YouTube Channel: youtube.com/c/VasilyTrader
✅ Facebook: facebook.com/VasilyTrading/
⭐ Get 100% Deposit Bonus: bit.ly/bestforexgoldbroker
❗️YouTube Channel: youtube.com/c/VasilyTrader
✅ Facebook: facebook.com/VasilyTrading/
⭐ Get 100% Deposit Bonus: bit.ly/bestforexgoldbroker
관련 발행물
면책사항
해당 정보와 게시물은 금융, 투자, 트레이딩 또는 기타 유형의 조언이나 권장 사항으로 간주되지 않으며, 트레이딩뷰에서 제공하거나 보증하는 것이 아닙니다. 자세한 내용은 이용 약관을 참조하세요.