
It is amazing how different approaches give same projection
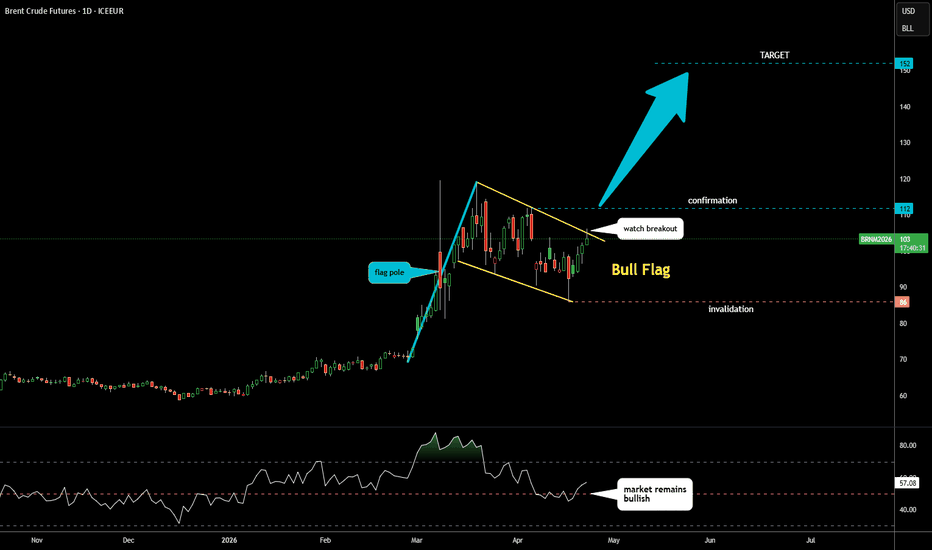
Month ago, I shared with you the Bull Flag pattern on this very same chart
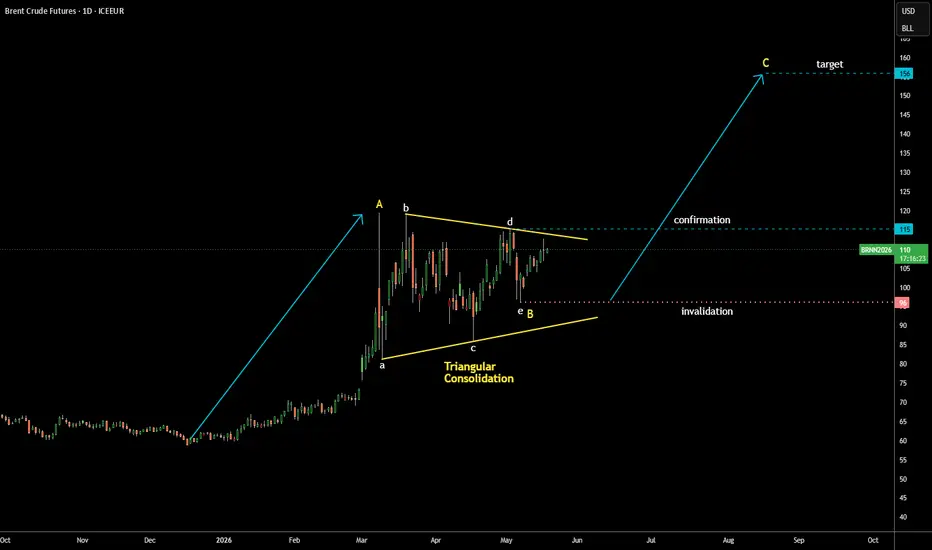
This time, I spotted the EW Triangular consolidation (yellow) in wave B
as part of ABC pattern, which targets the same area above $150 as Bull Flag does
All requirements for triangles have been met, ABCDE sequence looks completed
Wave B (Triangle) retraced exactly to 38.2% Fibonacci level and then bounced up
Bullish confirmation is set above the triangle on the breakout of peak of wave D beyond $115
Wave C could hit $156 mark if its size would be the same as wave A
Invalidation is set at the bottom of wave e of Triangle below $96
Month ago, I shared with you the Bull Flag pattern on this very same chart
This time, I spotted the EW Triangular consolidation (yellow) in wave B
as part of ABC pattern, which targets the same area above $150 as Bull Flag does
All requirements for triangles have been met, ABCDE sequence looks completed
Wave B (Triangle) retraced exactly to 38.2% Fibonacci level and then bounced up
Bullish confirmation is set above the triangle on the breakout of peak of wave D beyond $115
Wave C could hit $156 mark if its size would be the same as wave A
Invalidation is set at the bottom of wave e of Triangle below $96

관련 발행물
면책사항
해당 정보와 게시물은 금융, 투자, 트레이딩 또는 기타 유형의 조언이나 권장 사항으로 간주되지 않으며, 트레이딩뷰에서 제공하거나 보증하는 것이 아닙니다. 자세한 내용은 이용 약관을 참조하세요.
면책사항
해당 정보와 게시물은 금융, 투자, 트레이딩 또는 기타 유형의 조언이나 권장 사항으로 간주되지 않으며, 트레이딩뷰에서 제공하거나 보증하는 것이 아닙니다. 자세한 내용은 이용 약관을 참조하세요.