
Hello!
This is continuation from my previous analysis Bitcoin Dominance.
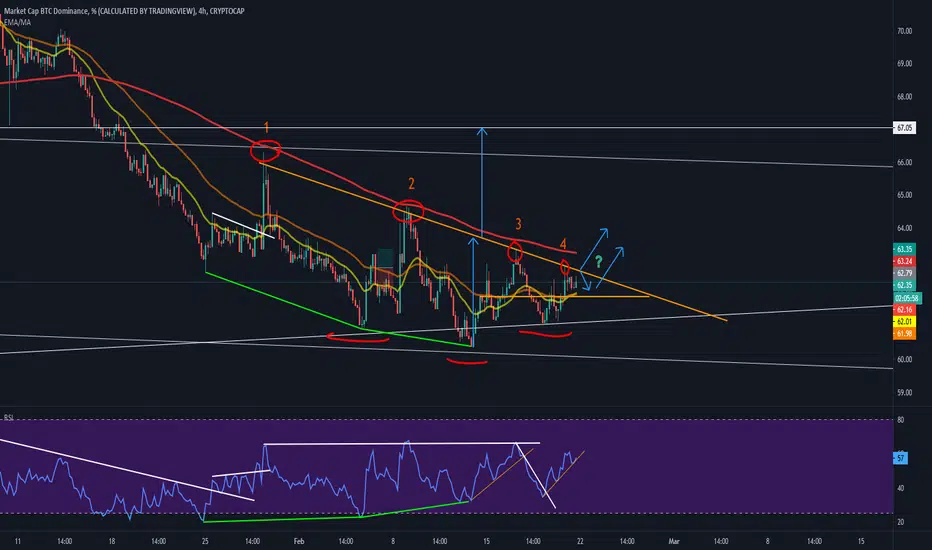
We did go take some more speed and we are back with recharged batteries. Orange trendline has worked as a resistance and I'm interested to see when it breaks.
We have now tested it 4 times. The more times trendlines (supports or resistances) are hit the more probably it will break. (followers should know this already)
Right after the trendline there is 200 EMA which can bring sell pressure. Maybe we will break and retest.
Green on RSI shows some Bullish Divergences which usually tells that a trend change could be on the way.
What has changed now:
We can see that after the last touch we have made smaller dip than the previous 3 times. That tells me there is more bulls now. We do need to see this 4 hr candle close ofc first. We can also do similar break as before on RSI, lose some dominance and give a possibly "last stretch" to alts.
We now have formed a nice looking inverted head and shoulders (Red marks) which tells us there is more bulls than when the head was emerging (Higher low)
Jebu
This is continuation from my previous analysis Bitcoin Dominance.
We did go take some more speed and we are back with recharged batteries. Orange trendline has worked as a resistance and I'm interested to see when it breaks.
We have now tested it 4 times. The more times trendlines (supports or resistances) are hit the more probably it will break. (followers should know this already)
Right after the trendline there is 200 EMA which can bring sell pressure. Maybe we will break and retest.
Green on RSI shows some Bullish Divergences which usually tells that a trend change could be on the way.
What has changed now:
We can see that after the last touch we have made smaller dip than the previous 3 times. That tells me there is more bulls now. We do need to see this 4 hr candle close ofc first. We can also do similar break as before on RSI, lose some dominance and give a possibly "last stretch" to alts.
We now have formed a nice looking inverted head and shoulders (Red marks) which tells us there is more bulls than when the head was emerging (Higher low)
Jebu
노트
Weekly time frame support and spinning bot노트
If you like big timeframe analysis you love this montly support노트
Either way Bitcoin can rise and alts (most are shit coins) lose marketcapor Bitcoin falls and alts bleed more. I don't think we will close lower than that on monthy. Atleast for now

관련 발행물
면책사항
해당 정보와 게시물은 금융, 투자, 트레이딩 또는 기타 유형의 조언이나 권장 사항으로 간주되지 않으며, 트레이딩뷰에서 제공하거나 보증하는 것이 아닙니다. 자세한 내용은 이용 약관을 참조하세요.
관련 발행물
면책사항
해당 정보와 게시물은 금융, 투자, 트레이딩 또는 기타 유형의 조언이나 권장 사항으로 간주되지 않으며, 트레이딩뷰에서 제공하거나 보증하는 것이 아닙니다. 자세한 내용은 이용 약관을 참조하세요.