
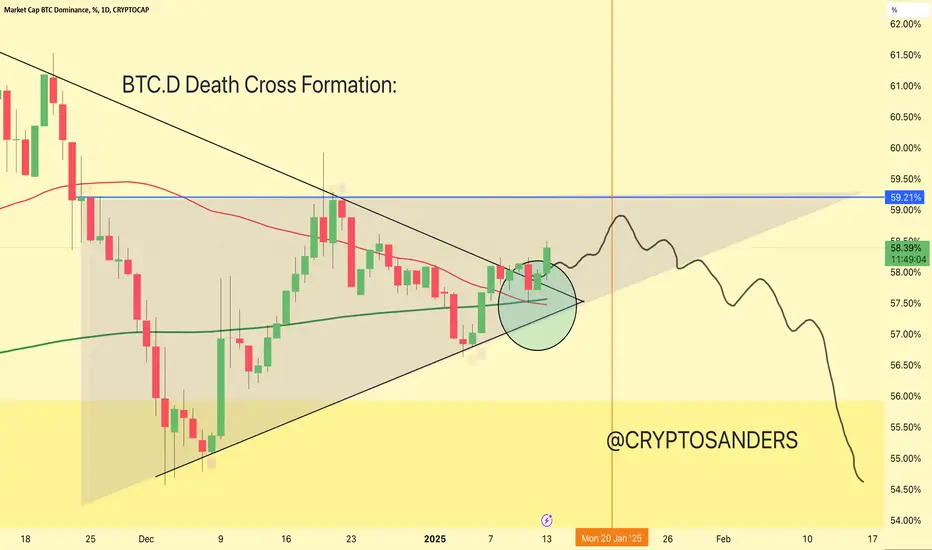
The “death cross” occurs when the short-term moving average (50-day MA) crosses below the long-term moving average (200-day MA).
This is considered a bearish signal, often indicating a potential decline in the market.
In your chart, the highlighted circle represents this potential crossover or the situation after it.
The narrow trendline indicates a symmetrical triangle or wedge formation, where the price consolidates before the breakout.
The breakout direction appears to be initially upward, breaking above resistance but eventually moving downward.
The blue horizontal line at around 59.21% dominance is a key resistance area.
Bitcoin dominance has broken above the triangle for some time but may struggle to remain above resistance.
After initial upward movement, the chart suggests a downward trajectory, possibly retesting lower dominance levels (towards the 55.50% and 54% areas).
This implies a potential altcoin resurgence or broader market uncertainty if BTC.D declines.
The red and green moving averages are important in defining the current trend.
A bearish cross between these moving averages aligns with the death cross narrative and signals caution.
Let me know if you’d like further assistance or adjustments!
DYOR. NFA

관련 발행물
면책사항
해당 정보와 게시물은 금융, 투자, 트레이딩 또는 기타 유형의 조언이나 권장 사항으로 간주되지 않으며, 트레이딩뷰에서 제공하거나 보증하는 것이 아닙니다. 자세한 내용은 이용 약관을 참조하세요.
관련 발행물
면책사항
해당 정보와 게시물은 금융, 투자, 트레이딩 또는 기타 유형의 조언이나 권장 사항으로 간주되지 않으며, 트레이딩뷰에서 제공하거나 보증하는 것이 아닙니다. 자세한 내용은 이용 약관을 참조하세요.