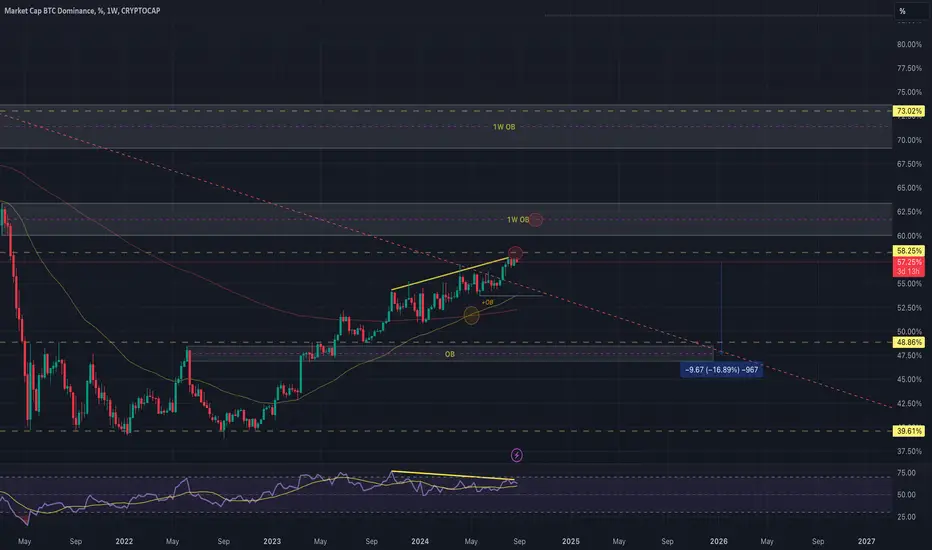
 BTC.D 1W chart;
Bitcoin Dominance has been moving horizontally at the same level for 3 weeks.
Let's not forget that the chart is weekly.
Although I think it will most likely return from the 58.25% level, I also stated that it may be better to go down after at least testing the 62.52% level above. The reason is that this will be very useful in the next bull cycle.
Considering the immediate level, it will start a downtrend with a close below the level indicated as +OB.
The noteworthy point here is the orange circle; the Golden Cross formed by the combination of 50EMA and 200EMA. This is a bullish sign.
However
After such a deep and prolonged decline, it would not be right to expect the chart to change direction and rise with the first Golden Cross. For this reason, I should mention that the level around 47% is important.
If the 47% level does not break sharply downwards, it may use this as support and start rising. If it breaks, we may see a decline up to 40%.

For more you can follow me on X. @UgurTash
면책사항
해당 정보와 게시물은 금융, 투자, 트레이딩 또는 기타 유형의 조언이나 권장 사항으로 간주되지 않으며, 트레이딩뷰에서 제공하거나 보증하는 것이 아닙니다. 자세한 내용은 이용 약관을 참조하세요.
For more you can follow me on X. @UgurTash
면책사항
해당 정보와 게시물은 금융, 투자, 트레이딩 또는 기타 유형의 조언이나 권장 사항으로 간주되지 않으며, 트레이딩뷰에서 제공하거나 보증하는 것이 아닙니다. 자세한 내용은 이용 약관을 참조하세요.