
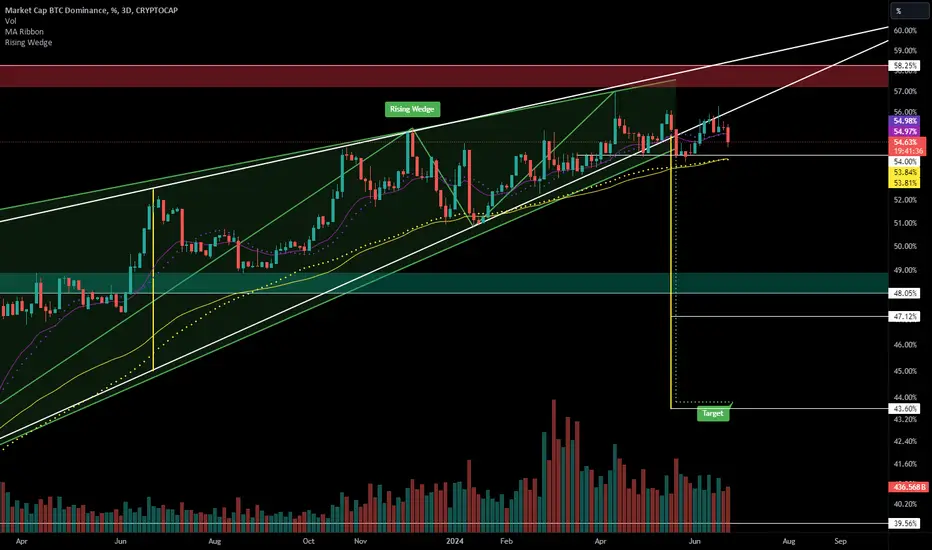
3-daily chart for BTC.D
Targets:
Prereqs:
Some confluence:
Daily line chart view:

Targets:
- Possible drop to support support initially.
- Then TP 1 around 47
- TP 2 ~43-44%.
Prereqs:
Remain below the wedge and lose 54% and then the 200 day EMA/MA just under it.
Some confluence:
My hand-drawn rising wedge on the log chart above has a measured TP 2 that lines up almost perfectly with the linear chart's "Rising Wedge" auto-pattern indicator.
Daily line chart view:

면책사항
해당 정보와 게시물은 금융, 투자, 트레이딩 또는 기타 유형의 조언이나 권장 사항으로 간주되지 않으며, 트레이딩뷰에서 제공하거나 보증하는 것이 아닙니다. 자세한 내용은 이용 약관을 참조하세요.
면책사항
해당 정보와 게시물은 금융, 투자, 트레이딩 또는 기타 유형의 조언이나 권장 사항으로 간주되지 않으며, 트레이딩뷰에서 제공하거나 보증하는 것이 아닙니다. 자세한 내용은 이용 약관을 참조하세요.