
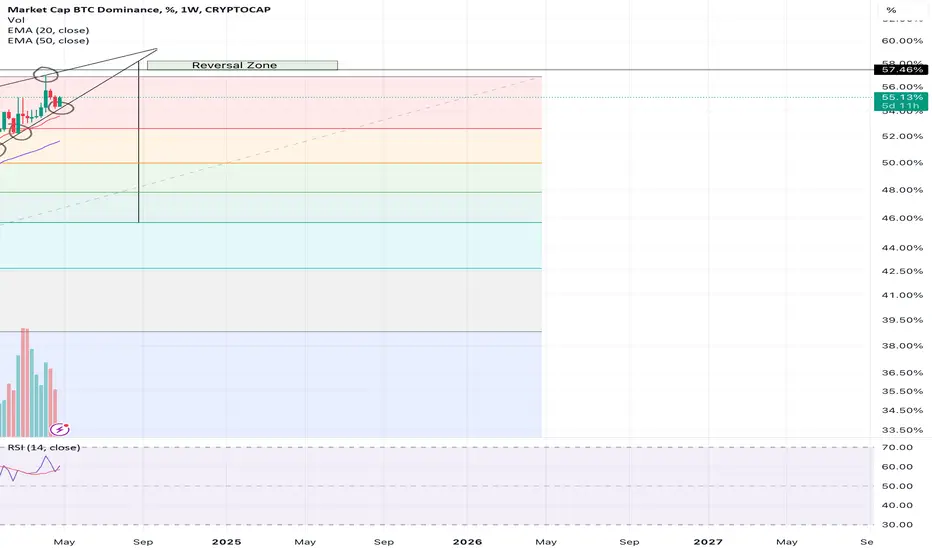
BTC.D is in rising wedge since Nov 2022. It's getting closer to the apex area. 82% rising wedges break towards downside. It seems that BTC will chop around in this after halving period, takes liquidity from both sides, and then will have a parabolic move by Aug-Sept 2024. Once BTC.D reaches the reversal zone range of 56-58%, it should break this rising wedge if not before. It's TP should be 45.7% which is a 0.618 fib level. ALTS should rally hard in the Q4 2024 if this TA works out.
매매 수동청산
Discard this Idea. I have posted this in a new thread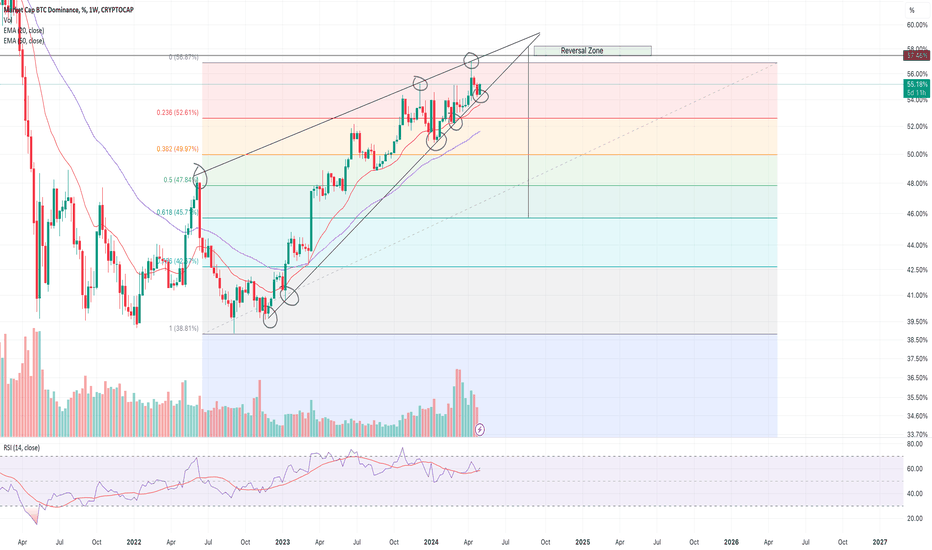

면책사항
해당 정보와 게시물은 금융, 투자, 트레이딩 또는 기타 유형의 조언이나 권장 사항으로 간주되지 않으며, 트레이딩뷰에서 제공하거나 보증하는 것이 아닙니다. 자세한 내용은 이용 약관을 참조하세요.
면책사항
해당 정보와 게시물은 금융, 투자, 트레이딩 또는 기타 유형의 조언이나 권장 사항으로 간주되지 않으며, 트레이딩뷰에서 제공하거나 보증하는 것이 아닙니다. 자세한 내용은 이용 약관을 참조하세요.