
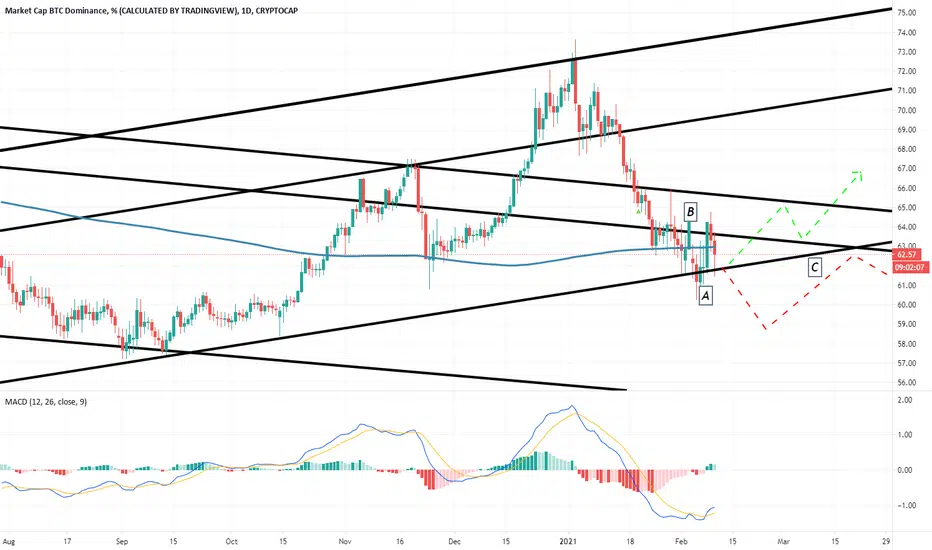
The Bitcoin dominance chart - i.e., the share of Bitcoin's market capitalization in the total crypto market - indicates the importance of the technical momentum that lies ahead in the coming days.
In recent hours, Bitcoin's strong upward movement was driven by the arrival at the support level (A) of the bullish channel that currently governs the movement.
After that bullish reaction, the apex formed by the crossing with a narrow bearish channel (B) was quickly reached and is now moving downwards, compressed by the confluence between both technical figures (C).
If it pierces the figure to the downside, it will signal future weakness of Bitcoin against Altcoins, which could push the Altcoin segment higher.
If, on the other hand, the price movement is bullish and breaks the technical hurdle, Bitcoin can literally fly higher and shatter Bitcoin valuations in the rest of the market.
The daily range MACD shows a profile that supports future developments to either side of the price, although it would be terminal and short-lived if it is a bearish move.

면책사항
해당 정보와 게시물은 금융, 투자, 트레이딩 또는 기타 유형의 조언이나 권장 사항으로 간주되지 않으며, 트레이딩뷰에서 제공하거나 보증하는 것이 아닙니다. 자세한 내용은 이용 약관을 참조하세요.
면책사항
해당 정보와 게시물은 금융, 투자, 트레이딩 또는 기타 유형의 조언이나 권장 사항으로 간주되지 않으며, 트레이딩뷰에서 제공하거나 보증하는 것이 아닙니다. 자세한 내용은 이용 약관을 참조하세요.