
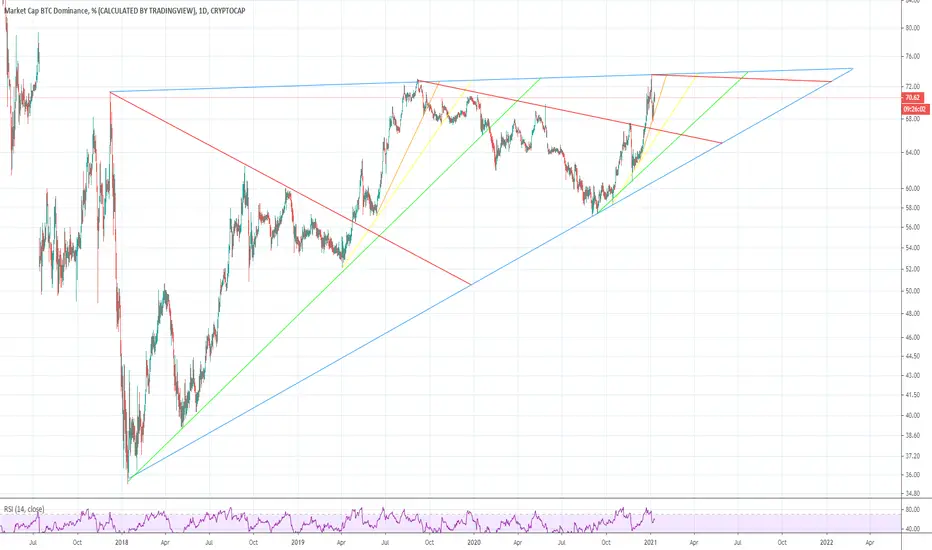
Same idea as the first chart I poasted a week ago but now the paranoid schizophrenic has found EVEN MORE patterns in the numbers!
The colored support lines that we are ranging through right now seem to be a scaled down fractal of the price action we saw in fall of 2019.
As of this chart's publishing date, we have just bounced off of the first orange support line, just like we did a couple years ago.
Will be looking for more confirmation to see if price action continues to mirror the previous iteration.
The colored support lines that we are ranging through right now seem to be a scaled down fractal of the price action we saw in fall of 2019.
As of this chart's publishing date, we have just bounced off of the first orange support line, just like we did a couple years ago.
Will be looking for more confirmation to see if price action continues to mirror the previous iteration.

면책사항
해당 정보와 게시물은 금융, 투자, 트레이딩 또는 기타 유형의 조언이나 권장 사항으로 간주되지 않으며, 트레이딩뷰에서 제공하거나 보증하는 것이 아닙니다. 자세한 내용은 이용 약관을 참조하세요.
면책사항
해당 정보와 게시물은 금융, 투자, 트레이딩 또는 기타 유형의 조언이나 권장 사항으로 간주되지 않으며, 트레이딩뷰에서 제공하거나 보증하는 것이 아닙니다. 자세한 내용은 이용 약관을 참조하세요.