
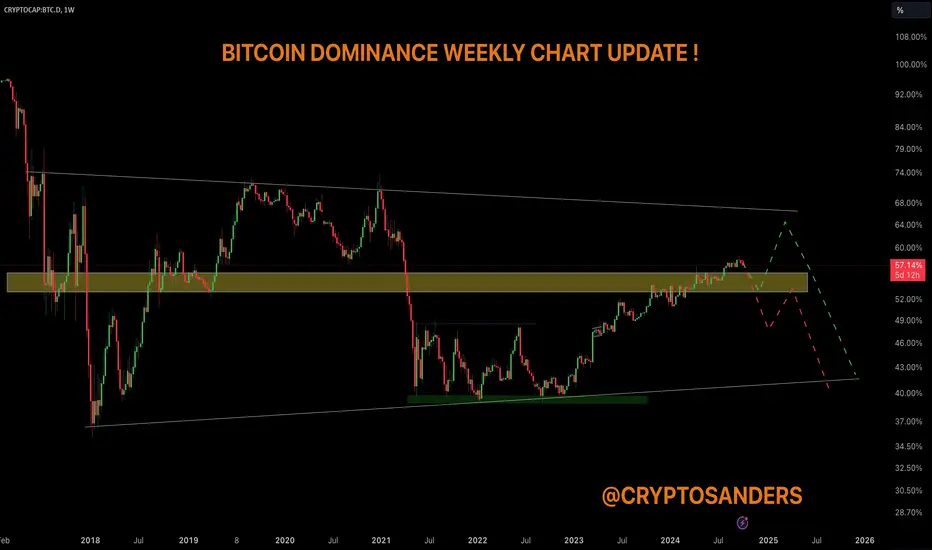
The Bitcoin Dominance Weekly Chart presents a comprehensive long-term view of BTC dominance.
Bitcoin dominance is moving within a long-term rising channel. The upper and lower trendlines of the channel have been tested multiple times, indicating a well-respected structure.
BTC dominance is approaching a key resistance zone between 57-58%. This zone has acted as both support and resistance in the past, as highlighted by the yellow box.
The recent upward momentum suggests a potential challenge of this resistance zone, but failure to break above it could lead to a reversal.
If BTC dominance is rejected from this resistance, it could start trending downwards within the channel, potentially retesting lower levels around 40-45% (as indicated by the red dotted line).
A decline in BTC dominance could signal strength in altcoins, as capital may flow from BTC to other cryptocurrencies.
If Bitcoin dominance breaks above the 58% resistance zone, we could see further gains up to the next major resistance near 64-65%, as suggested by the green dotted line.
This breakout would signify BTC outperforming other cryptocurrencies, potentially signaling market consolidation around Bitcoin.
This weekly chart is critical for understanding broader crypto market movements, as BTC dominance plays a key role in determining capital flows between Bitcoin and altcoins.
Would you like any further details or adjustments to this analysis?
Disclaimer: This analysis is for informational purposes and is not financial advice. Always stay updated with market movements and adjust your trading strategies as needed.
You can DM us for information on any other altcoin.
@Peter_CSAdmin

관련 발행물
면책사항
해당 정보와 게시물은 금융, 투자, 트레이딩 또는 기타 유형의 조언이나 권장 사항으로 간주되지 않으며, 트레이딩뷰에서 제공하거나 보증하는 것이 아닙니다. 자세한 내용은 이용 약관을 참조하세요.
관련 발행물
면책사항
해당 정보와 게시물은 금융, 투자, 트레이딩 또는 기타 유형의 조언이나 권장 사항으로 간주되지 않으며, 트레이딩뷰에서 제공하거나 보증하는 것이 아닙니다. 자세한 내용은 이용 약관을 참조하세요.