
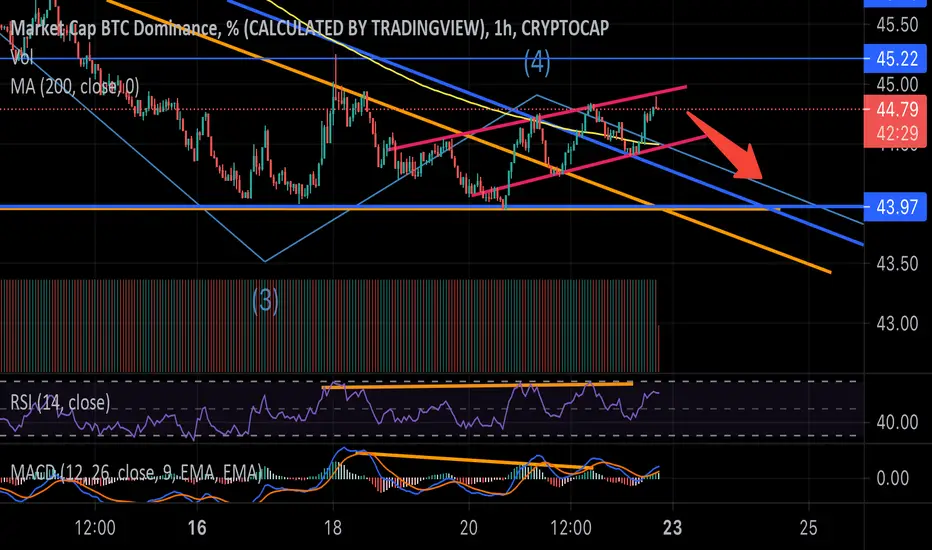
At this time, the chart shows us the bearish flag channel on 1H time frame. The graph will be fluctuating until complete its pattern on the chart.
Moreover, previous BTC.D analysis has been illustrated bearish patterns on our down trendy Eliot waves.
However, it should be ware of BTC on chain data, and also watch Total Market Cap excluding BTC chart
Moreover, previous BTC.D analysis has been illustrated bearish patterns on our down trendy Eliot waves.
However, it should be ware of BTC on chain data, and also watch Total Market Cap excluding BTC chart

면책사항
해당 정보와 게시물은 금융, 투자, 트레이딩 또는 기타 유형의 조언이나 권장 사항으로 간주되지 않으며, 트레이딩뷰에서 제공하거나 보증하는 것이 아닙니다. 자세한 내용은 이용 약관을 참조하세요.
면책사항
해당 정보와 게시물은 금융, 투자, 트레이딩 또는 기타 유형의 조언이나 권장 사항으로 간주되지 않으며, 트레이딩뷰에서 제공하거나 보증하는 것이 아닙니다. 자세한 내용은 이용 약관을 참조하세요.