
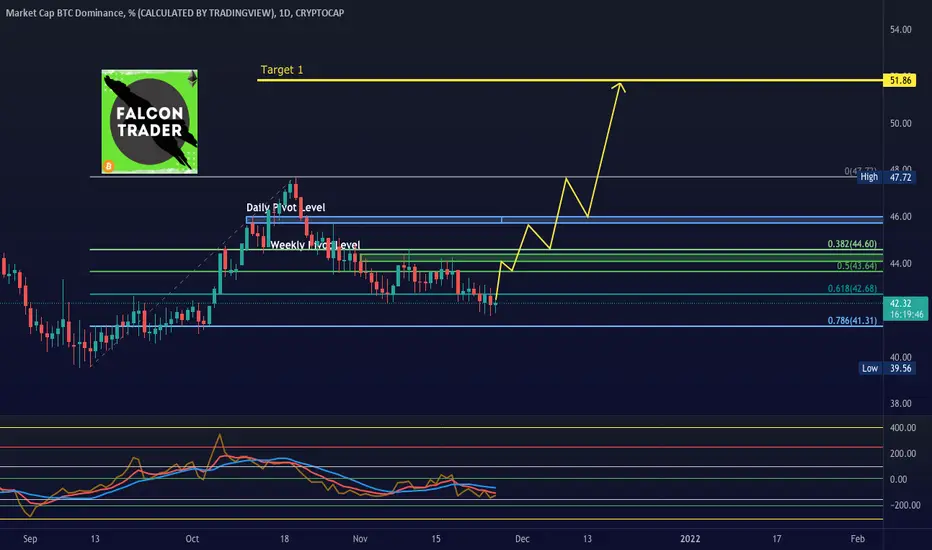
BTC.D is looking good now, after the correction that we have seen since 20th October top, also a sell signal on Falcon CCI Indicator on Trading View.
BTC.D, retraced to 61.8% levels, an important fib level, - does this mean this is Wave 2? I am not big fan of Elliott Waves but if this is Wave 2, then it will go up in Wave 3 to 161.8%. The target that I have set for this is just below those levels to around 51%, a very likely scenario considering Macro factors of inflation the news, and how new companies, countries and governments are adopting, obviously with some laws and framework - read India and Australia's recent cyber summit.
Not getting in too much details here, I think BTC.D is about to reverse, some key points for those will be Falcon CCI entry signal, a crossover that I always check.
How to trade, BTCUSDT is the key here, once this reversal happens then I will look at upside till the weekly resistance - do your homework and find that level.
All the best!
Don't forget to follow me on twitter, telegram and everywhere.
BTC.D, retraced to 61.8% levels, an important fib level, - does this mean this is Wave 2? I am not big fan of Elliott Waves but if this is Wave 2, then it will go up in Wave 3 to 161.8%. The target that I have set for this is just below those levels to around 51%, a very likely scenario considering Macro factors of inflation the news, and how new companies, countries and governments are adopting, obviously with some laws and framework - read India and Australia's recent cyber summit.
Not getting in too much details here, I think BTC.D is about to reverse, some key points for those will be Falcon CCI entry signal, a crossover that I always check.
How to trade, BTCUSDT is the key here, once this reversal happens then I will look at upside till the weekly resistance - do your homework and find that level.
All the best!
Don't forget to follow me on twitter, telegram and everywhere.
노트
Already started moving up! Reason: it was supposed to. Price action, Falcon CCI and overall market sentiment.
We may see BTCUSDT at 54K levels for a bounce if it goes bad from here.

면책사항
해당 정보와 게시물은 금융, 투자, 트레이딩 또는 기타 유형의 조언이나 권장 사항으로 간주되지 않으며, 트레이딩뷰에서 제공하거나 보증하는 것이 아닙니다. 자세한 내용은 이용 약관을 참조하세요.
면책사항
해당 정보와 게시물은 금융, 투자, 트레이딩 또는 기타 유형의 조언이나 권장 사항으로 간주되지 않으며, 트레이딩뷰에서 제공하거나 보증하는 것이 아닙니다. 자세한 내용은 이용 약관을 참조하세요.