
hey guys,
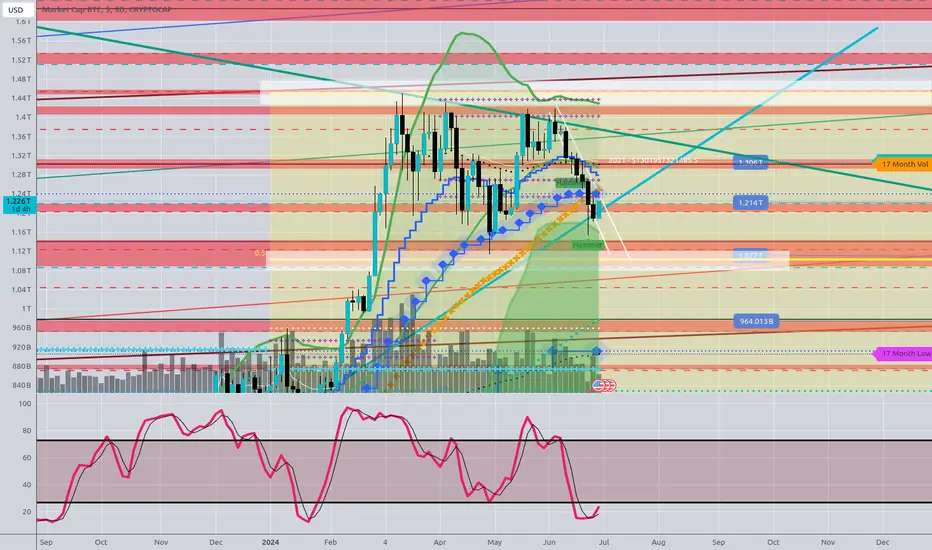
the yearly chart is bullish - main target was the recent ATH at 1.3T.
Quarterly Chart: After the break of the 1.3T Line theres a close below it
-> leaving a bit of doubt about imminent bullish progression or a potential double top forming here. The Inside bar is giving a warning of a possible reversal.
Monthly Chart: Although the demand Line is still intact there is a little divergence on the stochastic
-> there is weakness of 3 months not being able to penetrate highs - but going into a Consolidation.
-> BTC is testing a bullish trendline which, ones it has been broken by a close of the monthly candle, could provide a bearish setup and a possible double top scenario being in place.
I will wait for a break of the Consolidation to think about entering a trade.
Thanks for reading…
the yearly chart is bullish - main target was the recent ATH at 1.3T.
Quarterly Chart: After the break of the 1.3T Line theres a close below it
-> leaving a bit of doubt about imminent bullish progression or a potential double top forming here. The Inside bar is giving a warning of a possible reversal.
Monthly Chart: Although the demand Line is still intact there is a little divergence on the stochastic
-> there is weakness of 3 months not being able to penetrate highs - but going into a Consolidation.
-> BTC is testing a bullish trendline which, ones it has been broken by a close of the monthly candle, could provide a bearish setup and a possible double top scenario being in place.
I will wait for a break of the Consolidation to think about entering a trade.
Thanks for reading…
노트
good place to close bullish trades as I expect a retest of 1.2T
관련 발행물
면책사항
해당 정보와 게시물은 금융, 투자, 트레이딩 또는 기타 유형의 조언이나 권장 사항으로 간주되지 않으며, 트레이딩뷰에서 제공하거나 보증하는 것이 아닙니다. 자세한 내용은 이용 약관을 참조하세요.
관련 발행물
면책사항
해당 정보와 게시물은 금융, 투자, 트레이딩 또는 기타 유형의 조언이나 권장 사항으로 간주되지 않으며, 트레이딩뷰에서 제공하거나 보증하는 것이 아닙니다. 자세한 내용은 이용 약관을 참조하세요.