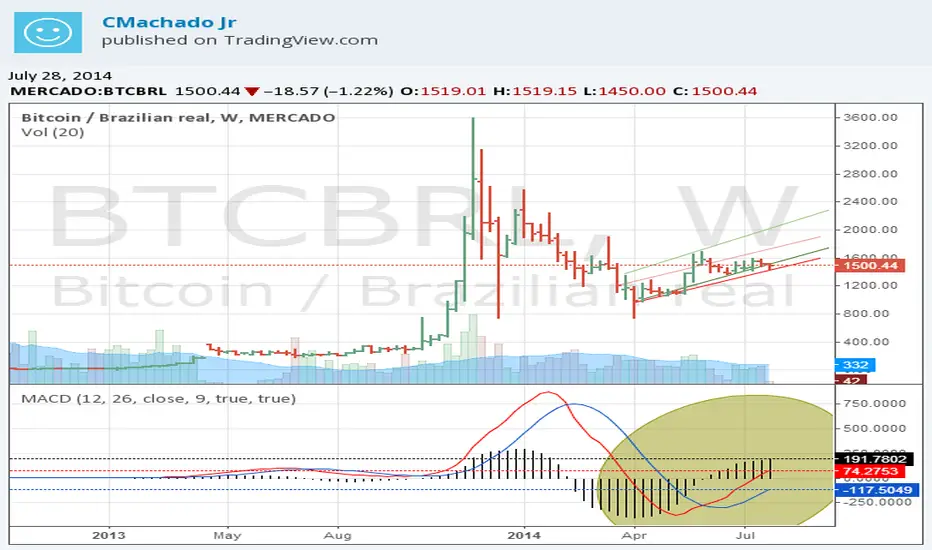
A linha do histograma macd= linha macd - linha sinal apresenta tendencia de alta, a linhas de suporte de baixa e de alta , em vermelho representando os momentos de baixa e as verdes representando os momentos de alta , mostram uma leve discrepancia, um angulo diferencial, das 2 linha verde, um que acusam um tendencia de alta.
The online macd histogram macd = line - trend line signal is high, the support lines of low and high, red representing low moments and green representing the moments of high, show a slight discrepancy, a differential angle ,red lines and green line , who suffers from a tendency to high.
The online macd histogram macd = line - trend line signal is high, the support lines of low and high, red representing low moments and green representing the moments of high, show a slight discrepancy, a differential angle ,red lines and green line , who suffers from a tendency to high.

면책사항
해당 정보와 게시물은 금융, 투자, 트레이딩 또는 기타 유형의 조언이나 권장 사항으로 간주되지 않으며, 트레이딩뷰에서 제공하거나 보증하는 것이 아닙니다. 자세한 내용은 이용 약관을 참조하세요.
면책사항
해당 정보와 게시물은 금융, 투자, 트레이딩 또는 기타 유형의 조언이나 권장 사항으로 간주되지 않으며, 트레이딩뷰에서 제공하거나 보증하는 것이 아닙니다. 자세한 내용은 이용 약관을 참조하세요.