
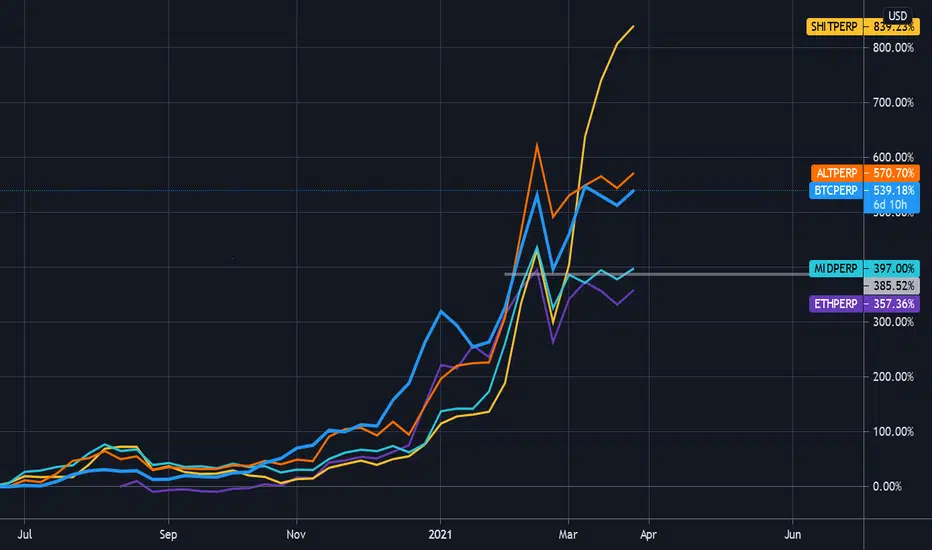
The idea behind this chart is to give a snapshot of the market breadth for the entire crypto market at a glance. It uses the perpetual index futures on the FTX exchange to compare Bitcoin to Ethereum, the ALT index, the Midcap index,and the SHIT index.
This particular chart is using a Weekly interval and uses the March 2020 lows as it's anchor point (adjust scale if necessary). It's clear to see that while Bitcoin has been grabbing most of the headlines, the SHITCOIN index is in the driver's seat (help.ftx.com/hc/en-us/articles/360027668812-Index-Calculation).
This particular chart is using a Weekly interval and uses the March 2020 lows as it's anchor point (adjust scale if necessary). It's clear to see that while Bitcoin has been grabbing most of the headlines, the SHITCOIN index is in the driver's seat (help.ftx.com/hc/en-us/articles/360027668812-Index-Calculation).

면책사항
해당 정보와 게시물은 금융, 투자, 트레이딩 또는 기타 유형의 조언이나 권장 사항으로 간주되지 않으며, 트레이딩뷰에서 제공하거나 보증하는 것이 아닙니다. 자세한 내용은 이용 약관을 참조하세요.
면책사항
해당 정보와 게시물은 금융, 투자, 트레이딩 또는 기타 유형의 조언이나 권장 사항으로 간주되지 않으며, 트레이딩뷰에서 제공하거나 보증하는 것이 아닙니다. 자세한 내용은 이용 약관을 참조하세요.