BTCST UP 138% and then another 328% after bullish signal 🚀🚀🚀
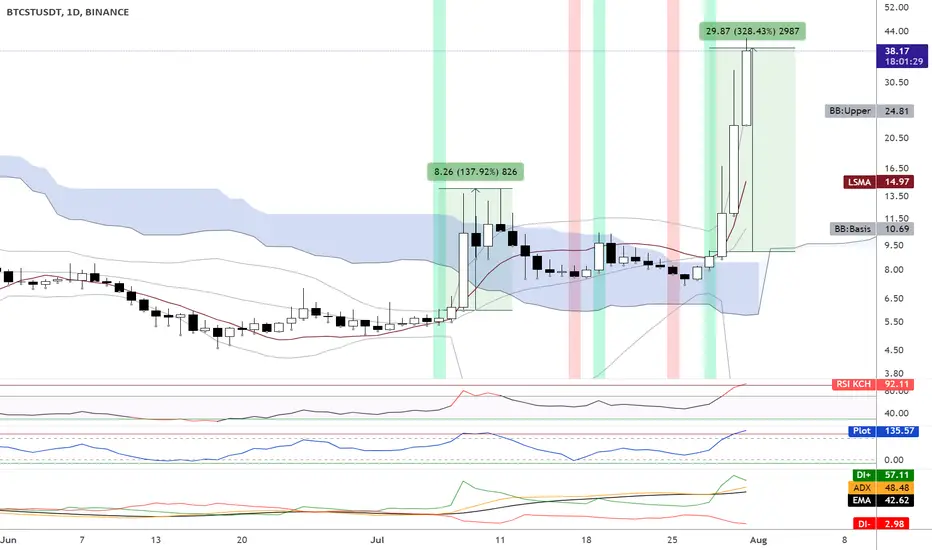
BTCST pumped 328% after the bullish Supertrend Ninja - Clean signal (green vertical line on the background). Before that it had a pump of 138%.
BTCST broke out of the bullish Zone of the Ichimoku Cloud, which is bullish . The RSI is in the overbought zone at 92. RSI Brown at 136. If we take a look at the Average Directional Index ( ADX DI) its starting to be bearish, as it is pointing downwards. Currently BTCST is way above its upper Bollinger Band, Band Basis 20 Period SMA . A retrace back within the Bollinger Band is more likely. The risk to reward right now to enter a trade is bad.
Remember to always take profits and use risk management.
Waiting patiently on a bullish Supertrend Ninja signal, before entering a long paid off.
Thank you for reading.
Namasté 🙏
Disclaimer: Ideas are for entertainment purposes only. Not financial advice. Your own due diligence is highly advised before entering trades. Past performance is no guarantee of future returns.
What Indicators Do I Use:
In the chart I am using the "Supertrend Ninja - Clean", which is a trend-following indicator (Green and red vertical lines on the background). When the background of the candlestick closes green (vertical line). It indicates a possible bullish (up)trend. And red for downtrends.
BTCST broke out of the bullish Zone of the Ichimoku Cloud, which is bullish . The RSI is in the overbought zone at 92. RSI Brown at 136. If we take a look at the Average Directional Index ( ADX DI) its starting to be bearish, as it is pointing downwards. Currently BTCST is way above its upper Bollinger Band, Band Basis 20 Period SMA . A retrace back within the Bollinger Band is more likely. The risk to reward right now to enter a trade is bad.
Remember to always take profits and use risk management.
Waiting patiently on a bullish Supertrend Ninja signal, before entering a long paid off.
Thank you for reading.
Namasté 🙏
Disclaimer: Ideas are for entertainment purposes only. Not financial advice. Your own due diligence is highly advised before entering trades. Past performance is no guarantee of future returns.
What Indicators Do I Use:
In the chart I am using the "Supertrend Ninja - Clean", which is a trend-following indicator (Green and red vertical lines on the background). When the background of the candlestick closes green (vertical line). It indicates a possible bullish (up)trend. And red for downtrends.

Beware of scammers. I do NOT have Telegram, Discord, Instagram, Twitter, Youtube or Facebook.
Tradingview is the only channel I use.
Tradingview is the only channel I use.
면책사항
해당 정보와 게시물은 금융, 투자, 트레이딩 또는 기타 유형의 조언이나 권장 사항으로 간주되지 않으며, 트레이딩뷰에서 제공하거나 보증하는 것이 아닙니다. 자세한 내용은 이용 약관을 참조하세요.
Beware of scammers. I do NOT have Telegram, Discord, Instagram, Twitter, Youtube or Facebook.
Tradingview is the only channel I use.
Tradingview is the only channel I use.
면책사항
해당 정보와 게시물은 금융, 투자, 트레이딩 또는 기타 유형의 조언이나 권장 사항으로 간주되지 않으며, 트레이딩뷰에서 제공하거나 보증하는 것이 아닙니다. 자세한 내용은 이용 약관을 참조하세요.