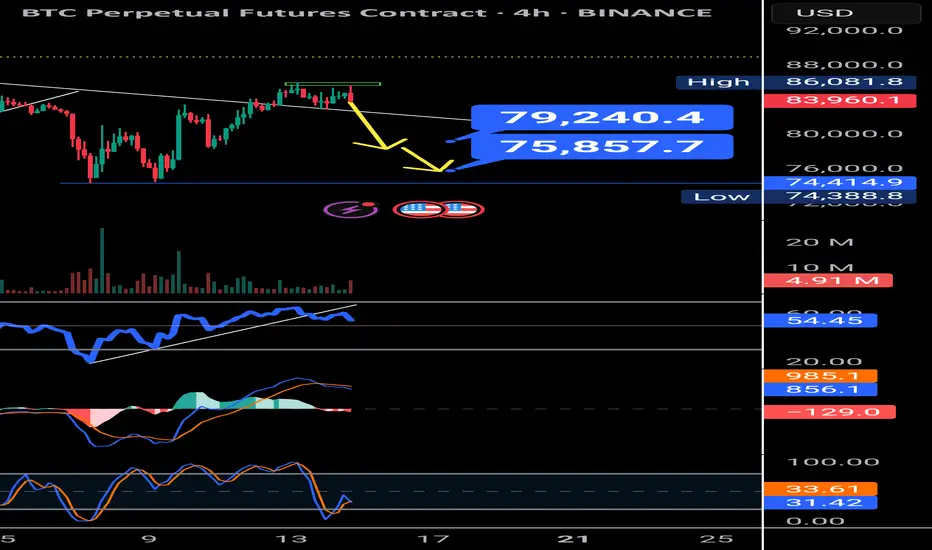
 BTC previously formed a strong double bottom around the $74,500 level, which led to a bullish rally pushing the price up to a saturation zone near $86,000. However, current price action suggests a double top formation — a classic bearish reversal pattern. This aligns with RSI trendline rejection and signs of bearish divergence, reinforcing the bearish sentiment.
The key question: Is this a correction or the start of a deeper dump?
If BTC holds above $79,000, it may just be a healthy correction.
A breakdown below $79,000 brings the next support near $76,000 into focus.
If that fails, Bitcoin could revisit the $69,000 zone, which aligns with earlier consolidation.
Traders should monitor RSI closely and watch for reaction at the support zones. Opportunities exist for both short-term scalps and long-term positions near key levels.

FOLLOW MY TELEGRAM CHANNEL FOR FREE : bit.ly/3JfrpgV
관련 발행물
면책사항
해당 정보와 게시물은 금융, 투자, 트레이딩 또는 기타 유형의 조언이나 권장 사항으로 간주되지 않으며, 트레이딩뷰에서 제공하거나 보증하는 것이 아닙니다. 자세한 내용은 이용 약관을 참조하세요.
FOLLOW MY TELEGRAM CHANNEL FOR FREE : bit.ly/3JfrpgV
관련 발행물
면책사항
해당 정보와 게시물은 금융, 투자, 트레이딩 또는 기타 유형의 조언이나 권장 사항으로 간주되지 않으며, 트레이딩뷰에서 제공하거나 보증하는 것이 아닙니다. 자세한 내용은 이용 약관을 참조하세요.