
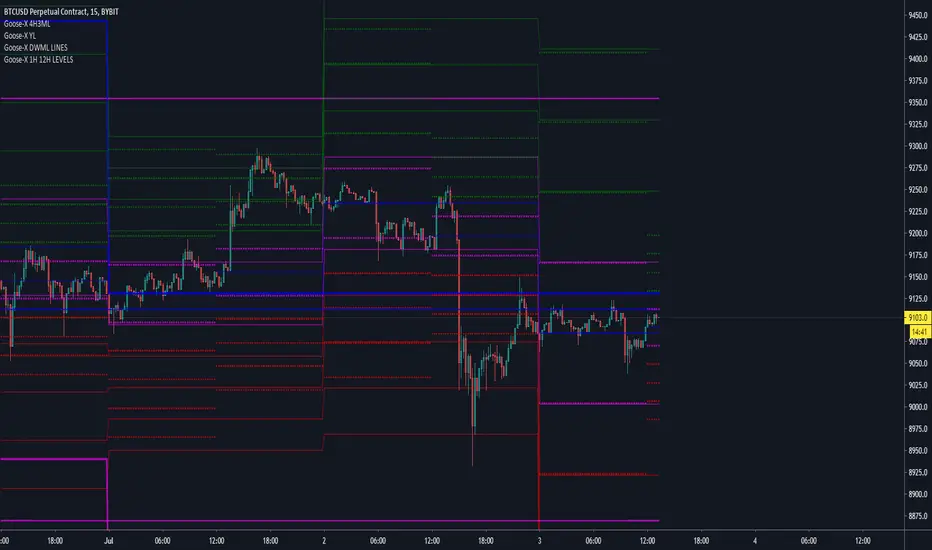
Chart containing all GX levels ( support/resistance ) of various periods: 1hr, 4hr, 12hr, 1day, 1week, 1month, 3months, 1year.
These are the most important and pre-fixed support/resist zones already written at every 00:00 UTC of the used period.
For example yearly levels are written there since 1° Jan 2020 00:00 UTC
These are the most important and pre-fixed support/resist zones already written at every 00:00 UTC of the used period.
For example yearly levels are written there since 1° Jan 2020 00:00 UTC

면책사항
해당 정보와 게시물은 금융, 투자, 트레이딩 또는 기타 유형의 조언이나 권장 사항으로 간주되지 않으며, 트레이딩뷰에서 제공하거나 보증하는 것이 아닙니다. 자세한 내용은 이용 약관을 참조하세요.
면책사항
해당 정보와 게시물은 금융, 투자, 트레이딩 또는 기타 유형의 조언이나 권장 사항으로 간주되지 않으며, 트레이딩뷰에서 제공하거나 보증하는 것이 아닙니다. 자세한 내용은 이용 약관을 참조하세요.