
Hello All and welcome!
Leave a like and comment!
Follow me if you enjoy these updates!
Please reference my last 2 posts on BTC before reading this one!
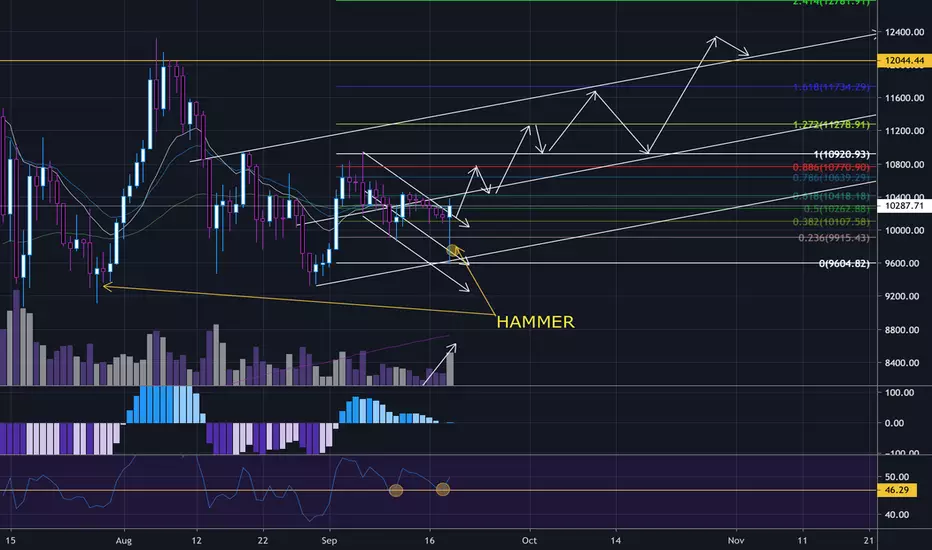
BTC never went back under the 0.786 level from the previous analysis. We waited for a better entry level down at the $9,500 level but never got it. Throughout the day we had a consolidation pattern that "should" have broken to the downside but our MACD oscillator gave us a clue as to why that wouldn't happen. Instead of negative momentum to begin again after cooling down from the previous drop, we saw positive momentum shift the trend, breaking the pendant to the upside exactly to the 0.5 fib level. price bullishly consolidated over the potential bear flag and broke up to the 0.5 level again to break it. Now we are bullishly consolidating again, and this time over a descending channel that broke down from $11,000 range. If the daily candle ends up looking like this one seen right before this rise up until $12,400, we should start to see something resembling a new rising channel formation to the ultimate target of $11,700! We can see on the RSI 1D chart that there is a bullish divergence bounce from the same level while sustaining lower prices.
Let me know what you think will happen with BTC!
This is only my opinion! This is not financial advice!
Leave a like and comment!
Follow me if you enjoy these updates!
Please reference my last 2 posts on BTC before reading this one!
BTC never went back under the 0.786 level from the previous analysis. We waited for a better entry level down at the $9,500 level but never got it. Throughout the day we had a consolidation pattern that "should" have broken to the downside but our MACD oscillator gave us a clue as to why that wouldn't happen. Instead of negative momentum to begin again after cooling down from the previous drop, we saw positive momentum shift the trend, breaking the pendant to the upside exactly to the 0.5 fib level. price bullishly consolidated over the potential bear flag and broke up to the 0.5 level again to break it. Now we are bullishly consolidating again, and this time over a descending channel that broke down from $11,000 range. If the daily candle ends up looking like this one seen right before this rise up until $12,400, we should start to see something resembling a new rising channel formation to the ultimate target of $11,700! We can see on the RSI 1D chart that there is a bullish divergence bounce from the same level while sustaining lower prices.
Let me know what you think will happen with BTC!
This is only my opinion! This is not financial advice!
노트
measure the flag for yourself! they are the same size!
노트
The resembles is uncanny!
$10,500 Is the target area.
노트
different approach 1D chart hammer formation in confluence area, false breakout.
노트
visualized on the 4H chart노트
노트

면책사항
해당 정보와 게시물은 금융, 투자, 트레이딩 또는 기타 유형의 조언이나 권장 사항으로 간주되지 않으며, 트레이딩뷰에서 제공하거나 보증하는 것이 아닙니다. 자세한 내용은 이용 약관을 참조하세요.
면책사항
해당 정보와 게시물은 금융, 투자, 트레이딩 또는 기타 유형의 조언이나 권장 사항으로 간주되지 않으며, 트레이딩뷰에서 제공하거나 보증하는 것이 아닙니다. 자세한 내용은 이용 약관을 참조하세요.