
#BTC
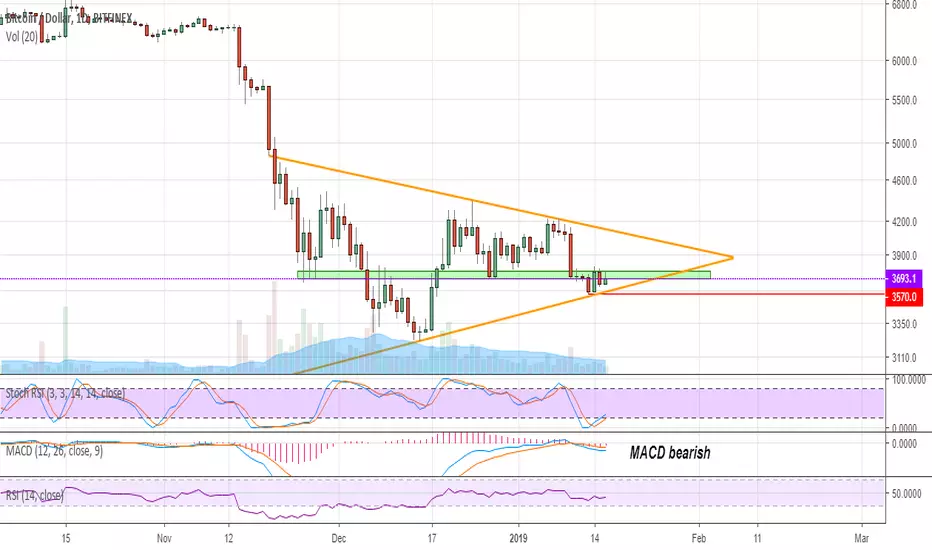
The month-wide RSI goes below the past minimum visible on Bitfinex. As you can see, the market has not received adequate support, globally it is very likely that the RSI will continue to decline further to the oversold area. MACD on the same scale continues to look not promising, apparently, and will continue to decline. It does not seem that the market has globally reached the bottom, there is still much to fall in, in case of going below 3000 we can even get closer to 1200. A 1-day scale shows a symmetrical triangle; on the downtrend, this pattern indicates the likelihood of a further decline. At the moment, the price is below the area (green range) necessary to maintain a positive and the possibility of further growth. We need to lock in above and head to the upper face of the triangle, otherwise we will continue to tighten the flat. The negative scenario, which is most likely now, is the breakdown of the lower edge of the triangle and the test mark of 3570, in the event of a breakdown of this support, the market will continue the bearish trend and we will further decline.
The month-wide RSI goes below the past minimum visible on Bitfinex. As you can see, the market has not received adequate support, globally it is very likely that the RSI will continue to decline further to the oversold area. MACD on the same scale continues to look not promising, apparently, and will continue to decline. It does not seem that the market has globally reached the bottom, there is still much to fall in, in case of going below 3000 we can even get closer to 1200. A 1-day scale shows a symmetrical triangle; on the downtrend, this pattern indicates the likelihood of a further decline. At the moment, the price is below the area (green range) necessary to maintain a positive and the possibility of further growth. We need to lock in above and head to the upper face of the triangle, otherwise we will continue to tighten the flat. The negative scenario, which is most likely now, is the breakdown of the lower edge of the triangle and the test mark of 3570, in the event of a breakdown of this support, the market will continue the bearish trend and we will further decline.

면책사항
해당 정보와 게시물은 금융, 투자, 트레이딩 또는 기타 유형의 조언이나 권장 사항으로 간주되지 않으며, 트레이딩뷰에서 제공하거나 보증하는 것이 아닙니다. 자세한 내용은 이용 약관을 참조하세요.
면책사항
해당 정보와 게시물은 금융, 투자, 트레이딩 또는 기타 유형의 조언이나 권장 사항으로 간주되지 않으며, 트레이딩뷰에서 제공하거나 보증하는 것이 아닙니다. 자세한 내용은 이용 약관을 참조하세요.