
Hello, welcome to this BITCOIN /USDT update by CRYPTO SANDERS.
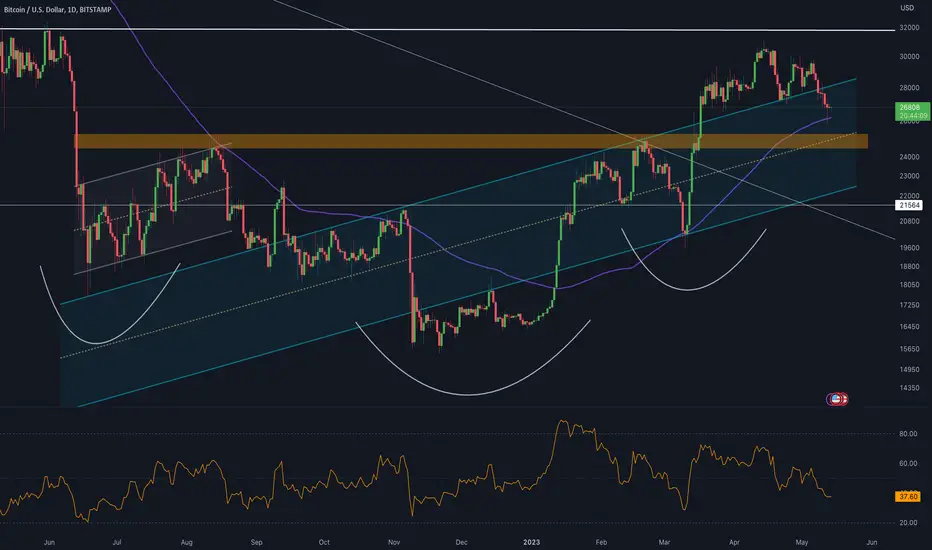
CHART ANALYSIS:- Bitcoin (BTC) moved away from a recent two-month low on Saturday, as bulls opted to buy the recent dip.
After falling to a low of 25,878.43 on Friday, BTC/USD rose to an intraday high of 26,989.07 earlier in the day.
Today’s rebound sees bitcoin jump back above a key support point at 26,500, following Friday’s breakout.
From the chart, it appears that this took place as the 14-day relative strength index (RSI) found a floor of its own at 36.00.
price strength is tracking at 37.99, with a ceiling of 43.00 as a possible target.
Should bulls lead the charge to this point, it is likely that Bitcoin will be back above the 27,000 level this weekend.
I have tried to bring the best possible outcome to this chart.
Hit the like button if you like it and share your charts in the comments section.
Thank you
CHART ANALYSIS:- Bitcoin (BTC) moved away from a recent two-month low on Saturday, as bulls opted to buy the recent dip.
After falling to a low of 25,878.43 on Friday, BTC/USD rose to an intraday high of 26,989.07 earlier in the day.
Today’s rebound sees bitcoin jump back above a key support point at 26,500, following Friday’s breakout.
From the chart, it appears that this took place as the 14-day relative strength index (RSI) found a floor of its own at 36.00.
price strength is tracking at 37.99, with a ceiling of 43.00 as a possible target.
Should bulls lead the charge to this point, it is likely that Bitcoin will be back above the 27,000 level this weekend.
I have tried to bring the best possible outcome to this chart.
Hit the like button if you like it and share your charts in the comments section.
Thank you

관련 발행물
면책사항
해당 정보와 게시물은 금융, 투자, 트레이딩 또는 기타 유형의 조언이나 권장 사항으로 간주되지 않으며, 트레이딩뷰에서 제공하거나 보증하는 것이 아닙니다. 자세한 내용은 이용 약관을 참조하세요.
관련 발행물
면책사항
해당 정보와 게시물은 금융, 투자, 트레이딩 또는 기타 유형의 조언이나 권장 사항으로 간주되지 않으며, 트레이딩뷰에서 제공하거나 보증하는 것이 아닙니다. 자세한 내용은 이용 약관을 참조하세요.