
BTC/USDT – Weekly Chart Update
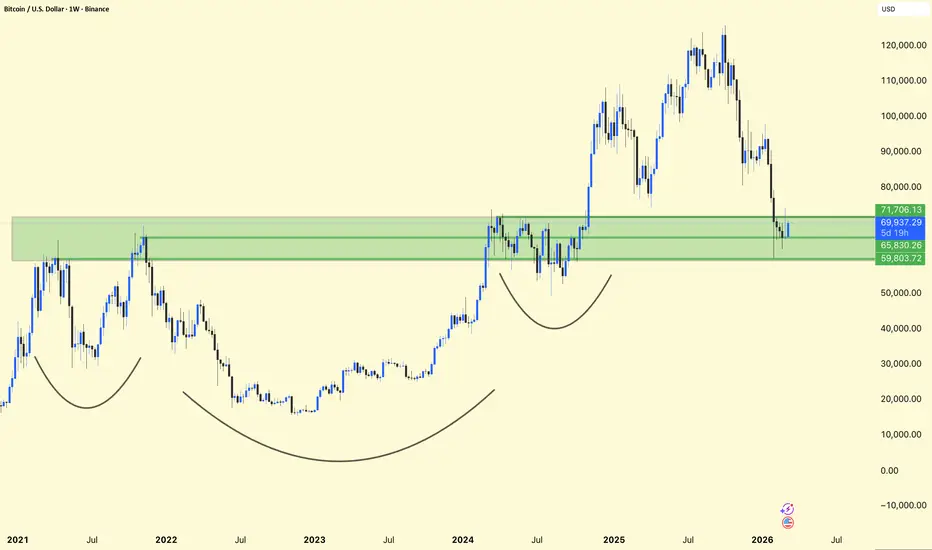
Bitcoin is currently testing a major weekly demand zone between $59K – $71K after the recent sharp correction from the highs.
Price has returned to a previous breakout and accumulation area.
This green zone acted as strong resistance in the past and is now acting as support.
The structure still resembles a large cup-type formation on the higher timeframe, suggesting long-term bullish potential if support holds.
Bullish Scenario:
Holding above $65K–$60K support could trigger a recovery.
A reclaim of $71K resistance may open the path toward $85K–$100K again.
Bearish Scenario:
If $59K support breaks, the next deeper correction zone could appear around $50K–$52K.
BTC is currently retesting a critical weekly support zone. The reaction here will likely determine whether the market continues the macro uptrend or enters a deeper correction phase.
Bitcoin is currently testing a major weekly demand zone between $59K – $71K after the recent sharp correction from the highs.
Price has returned to a previous breakout and accumulation area.
This green zone acted as strong resistance in the past and is now acting as support.
The structure still resembles a large cup-type formation on the higher timeframe, suggesting long-term bullish potential if support holds.
Bullish Scenario:
Holding above $65K–$60K support could trigger a recovery.
A reclaim of $71K resistance may open the path toward $85K–$100K again.
Bearish Scenario:
If $59K support breaks, the next deeper correction zone could appear around $50K–$52K.
BTC is currently retesting a critical weekly support zone. The reaction here will likely determine whether the market continues the macro uptrend or enters a deeper correction phase.

관련 발행물
면책사항
해당 정보와 게시물은 금융, 투자, 트레이딩 또는 기타 유형의 조언이나 권장 사항으로 간주되지 않으며, 트레이딩뷰에서 제공하거나 보증하는 것이 아닙니다. 자세한 내용은 이용 약관을 참조하세요.
관련 발행물
면책사항
해당 정보와 게시물은 금융, 투자, 트레이딩 또는 기타 유형의 조언이나 권장 사항으로 간주되지 않으며, 트레이딩뷰에서 제공하거나 보증하는 것이 아닙니다. 자세한 내용은 이용 약관을 참조하세요.