
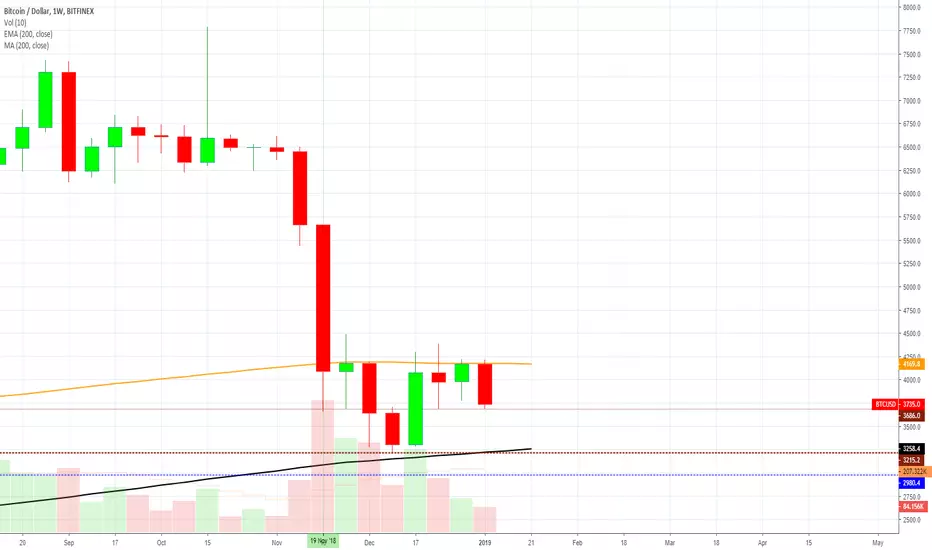
Here is the weekly chart for Bitcoin. Right now it is all about the orange line (EMA200) and black line (MA200)... With these indicators you can have a longer term perspective of what is happening and can also avoid panic: 
Support levels:
Thanks a lot for reading.
Namaste.
- (1) For Bitcoin to continue down/bearish it needs to break and close below the black line.
- (2) For Bitcoin to go bullish it needs to break with good volume and momentum the orange line and close above it.
- (3) This is Bitcoin Made Easy!
Support levels:
Thanks a lot for reading.
Namaste.
노트
Thanks a lot for the support, highly appreciated.노트
Bitcoin (BTCUSD) Price Action Update (4H Time Frame) + XBT LONG Trade: 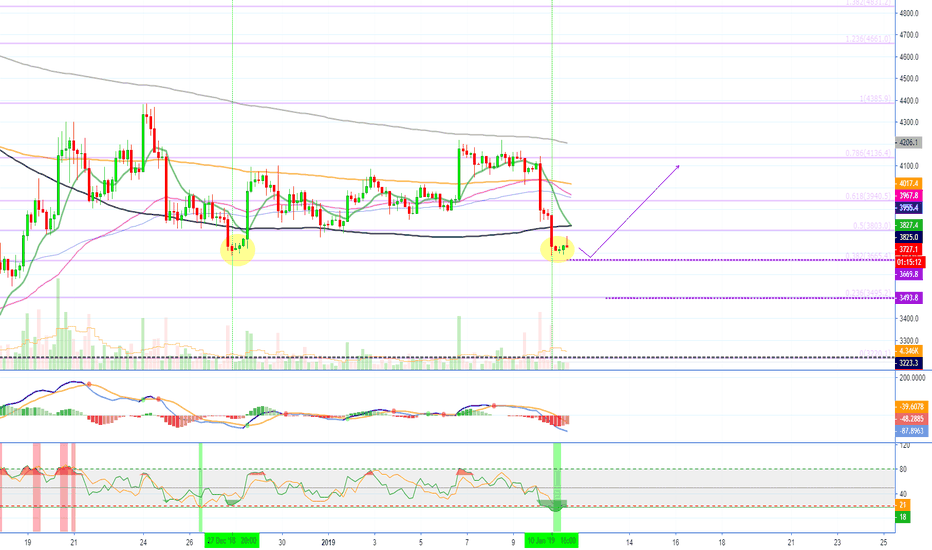
노트
MACD bullish crossover on the weekly and histogram turning in favor of the bulls.
Trading Cryptocurrencies can be the hardest undertaking ever without the right trade-numbers, without accurate private-access information. Free is free, but the best always requires sweat, an investment. Since 2017 👇
t.me/masteranandatrades/8778
t.me/masteranandatrades/8778
관련 발행물
면책사항
해당 정보와 게시물은 금융, 투자, 트레이딩 또는 기타 유형의 조언이나 권장 사항으로 간주되지 않으며, 트레이딩뷰에서 제공하거나 보증하는 것이 아닙니다. 자세한 내용은 이용 약관을 참조하세요.
Trading Cryptocurrencies can be the hardest undertaking ever without the right trade-numbers, without accurate private-access information. Free is free, but the best always requires sweat, an investment. Since 2017 👇
t.me/masteranandatrades/8778
t.me/masteranandatrades/8778
관련 발행물
면책사항
해당 정보와 게시물은 금융, 투자, 트레이딩 또는 기타 유형의 조언이나 권장 사항으로 간주되지 않으며, 트레이딩뷰에서 제공하거나 보증하는 것이 아닙니다. 자세한 내용은 이용 약관을 참조하세요.