
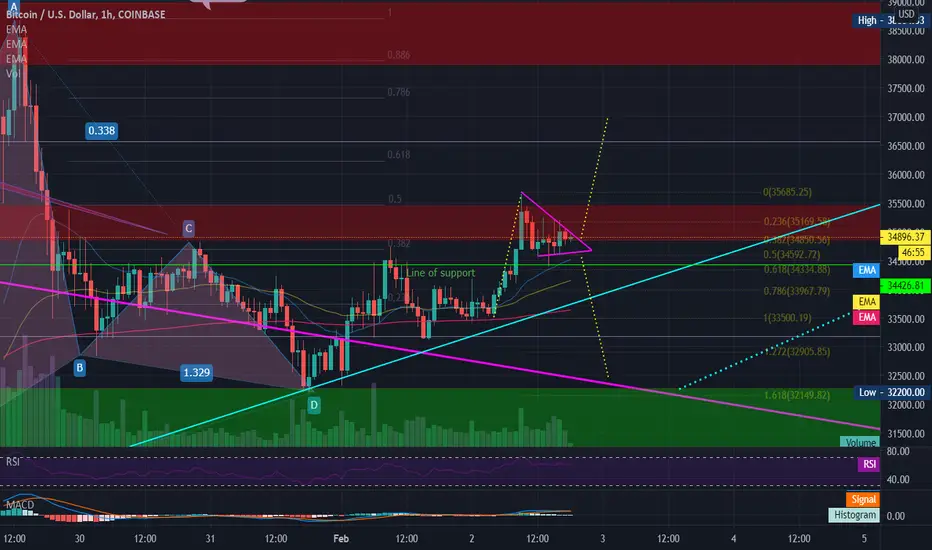
Looking at the 1hr chart it looks like Bitcoin has been rounding up it's pups and is ready to make a break for it.
The measured move up would give us a target above the red resistance box. I'll be looking for a back test to flip it to support if we get up above $35,500 again.
If we break down then I will be looking at several areas for support, the first being the .5 to .618 Fib retrace of the last move. About $32,200 would be my target for the downside and I'd be looking for a hard bounce from there.
Here is the daily chart. Is that an inverted head and shoulders?

If you twist my whiskers I'll admit my bullish bias.
The trend is our friend until it ends!
Owhooooo!
The measured move up would give us a target above the red resistance box. I'll be looking for a back test to flip it to support if we get up above $35,500 again.
If we break down then I will be looking at several areas for support, the first being the .5 to .618 Fib retrace of the last move. About $32,200 would be my target for the downside and I'd be looking for a hard bounce from there.
Here is the daily chart. Is that an inverted head and shoulders?
If you twist my whiskers I'll admit my bullish bias.
The trend is our friend until it ends!
Owhooooo!
노트
RAOWFF! 노트
A back test on the 4hr (or 1hr) or a continuation of the measured move?노트
The very rare Sleeping Dragon...we all know what happens when it awakens! Owhooooo!
노트
노트
The dragon is awake! $37,900 I think is the next stop!
면책사항
해당 정보와 게시물은 금융, 투자, 트레이딩 또는 기타 유형의 조언이나 권장 사항으로 간주되지 않으며, 트레이딩뷰에서 제공하거나 보증하는 것이 아닙니다. 자세한 내용은 이용 약관을 참조하세요.
면책사항
해당 정보와 게시물은 금융, 투자, 트레이딩 또는 기타 유형의 조언이나 권장 사항으로 간주되지 않으며, 트레이딩뷰에서 제공하거나 보증하는 것이 아닙니다. 자세한 내용은 이용 약관을 참조하세요.