
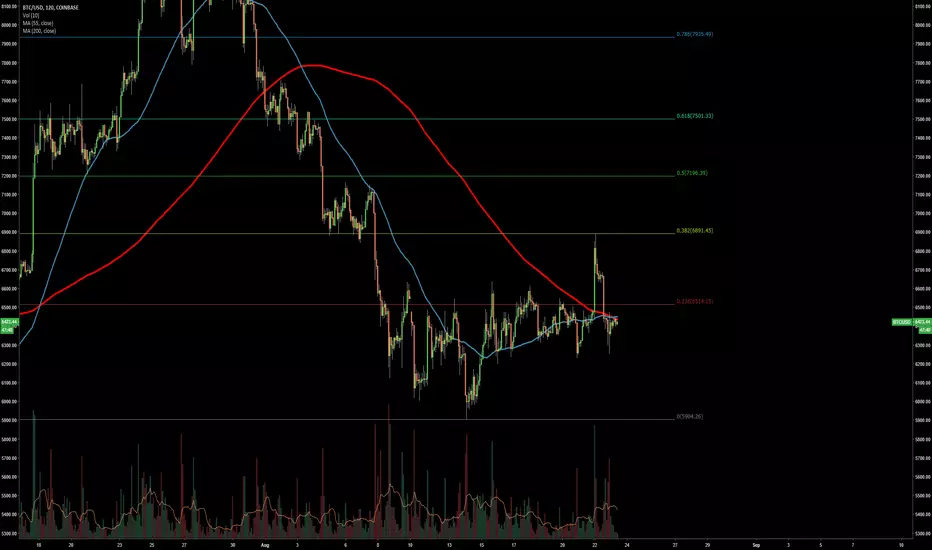
Here you see the same fibs on a 2HR chart.
The moving averages have moved with the price. The moving average is now based on 2HR candles instead of the daily candles in the previous chart.
This means the averages now show a cycle based on the 2HR and you can see the similar movement of the MA's with the daily chart. ( see our chapter market cycles)
On this timeframe, the 55MA is already crossing the 200MA showing a possible short term move up.
Key would be to break resistance area at the 0.236 fib, by break, we mean that we want to see the price stay above it as this would show us the previous resistance has now become support.
The moving averages have moved with the price. The moving average is now based on 2HR candles instead of the daily candles in the previous chart.
This means the averages now show a cycle based on the 2HR and you can see the similar movement of the MA's with the daily chart. ( see our chapter market cycles)
On this timeframe, the 55MA is already crossing the 200MA showing a possible short term move up.
Key would be to break resistance area at the 0.236 fib, by break, we mean that we want to see the price stay above it as this would show us the previous resistance has now become support.

관련 발행물
면책사항
해당 정보와 게시물은 금융, 투자, 트레이딩 또는 기타 유형의 조언이나 권장 사항으로 간주되지 않으며, 트레이딩뷰에서 제공하거나 보증하는 것이 아닙니다. 자세한 내용은 이용 약관을 참조하세요.
면책사항
해당 정보와 게시물은 금융, 투자, 트레이딩 또는 기타 유형의 조언이나 권장 사항으로 간주되지 않으며, 트레이딩뷰에서 제공하거나 보증하는 것이 아닙니다. 자세한 내용은 이용 약관을 참조하세요.