
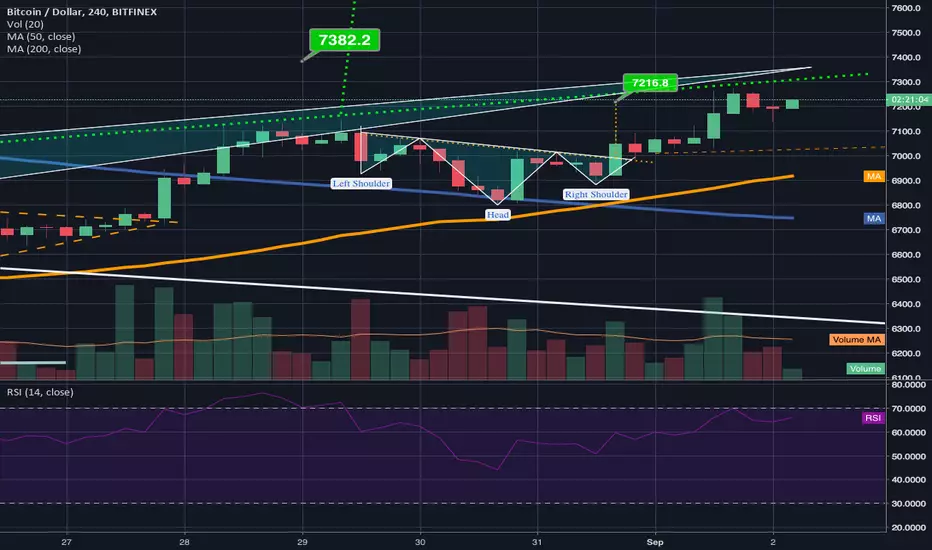
Usually right after we hit a higher high we see a lower high and while I think considering we are still finding resistance at the much larger/longer inverted head and shoulder neckline we will likely dip down for another higher low here. before we finally break the neckline of the larger inv h&s. I think odds are good if we see that higher low form that we will most certainly trigger the 1 week charts descending triangle pattern...if so we will be bullish in a very big way as long as we can stay above the 1 day charts 50ma like we have been continuing to do we should trigger that breakout. Very hopeful for what Q4 might brig in btc.

면책사항
해당 정보와 게시물은 금융, 투자, 트레이딩 또는 기타 유형의 조언이나 권장 사항으로 간주되지 않으며, 트레이딩뷰에서 제공하거나 보증하는 것이 아닙니다. 자세한 내용은 이용 약관을 참조하세요.
면책사항
해당 정보와 게시물은 금융, 투자, 트레이딩 또는 기타 유형의 조언이나 권장 사항으로 간주되지 않으며, 트레이딩뷰에서 제공하거나 보증하는 것이 아닙니다. 자세한 내용은 이용 약관을 참조하세요.