
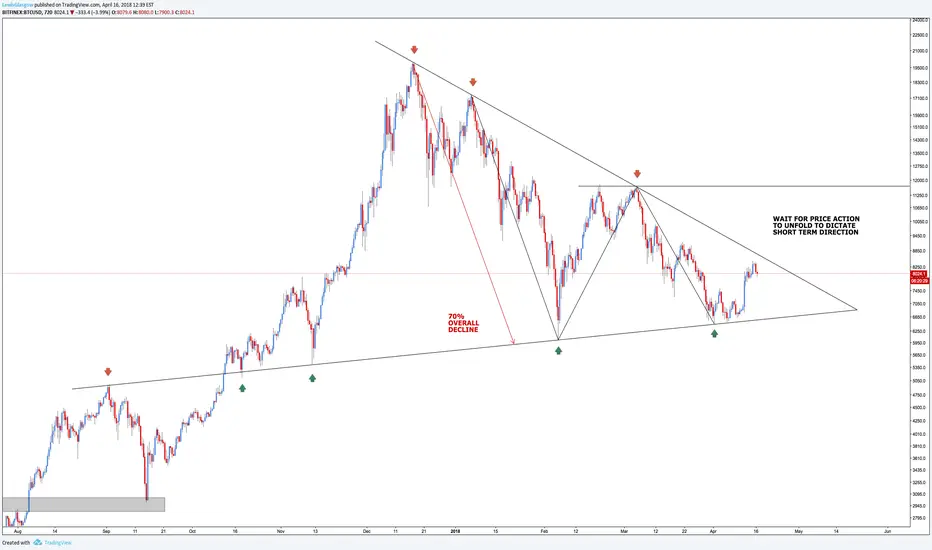
Traders I hope you are all well, today I'm presenting the basic price structure of bitcoin and what I see happening in the near future.
Dropping down to the 30m chart we can see price formed a symmetrical triangle at the market low, followed by an unexpected impulse on the 12th of April 2018. This was followed a brief period of advancement and now a break to the downside which indicates a short-term correction (bitcoin at present).

The extent of this correction can be measured as price develops, right now this is the two paths price will likely take.

As mentioned, wait for further price action to unfold to dictate short-term direction.
I'm currently in the process of producing a new article (relevant to my previous cyclical analysis) explaining how altcoins are now advancing into their first stage of a bullish cycle, this will be posted in the near future for you all to benefit from.
I didn't want to drag out this post, it's fairly simple to understand even for the novice analyst.
Thank you for your support!
Dropping down to the 30m chart we can see price formed a symmetrical triangle at the market low, followed by an unexpected impulse on the 12th of April 2018. This was followed a brief period of advancement and now a break to the downside which indicates a short-term correction (bitcoin at present).
The extent of this correction can be measured as price develops, right now this is the two paths price will likely take.
As mentioned, wait for further price action to unfold to dictate short-term direction.
I'm currently in the process of producing a new article (relevant to my previous cyclical analysis) explaining how altcoins are now advancing into their first stage of a bullish cycle, this will be posted in the near future for you all to benefit from.
I didn't want to drag out this post, it's fairly simple to understand even for the novice analyst.
Thank you for your support!
노트
Quick update on BTC/USD as price now returns to the support trendline that was drawn up in the original analysis.I would pay close attention to this structure on the 15m chart. A clear signal of downside movement and we can begin to reduce our position.
노트
Bitcoin on the 15-minute chart, looking at further downside this week.
📈 Master the Art and Science of Trading: sixfigurecapital.com
관련 발행물
면책사항
해당 정보와 게시물은 금융, 투자, 트레이딩 또는 기타 유형의 조언이나 권장 사항으로 간주되지 않으며, 트레이딩뷰에서 제공하거나 보증하는 것이 아닙니다. 자세한 내용은 이용 약관을 참조하세요.
📈 Master the Art and Science of Trading: sixfigurecapital.com
관련 발행물
면책사항
해당 정보와 게시물은 금융, 투자, 트레이딩 또는 기타 유형의 조언이나 권장 사항으로 간주되지 않으며, 트레이딩뷰에서 제공하거나 보증하는 것이 아닙니다. 자세한 내용은 이용 약관을 참조하세요.