
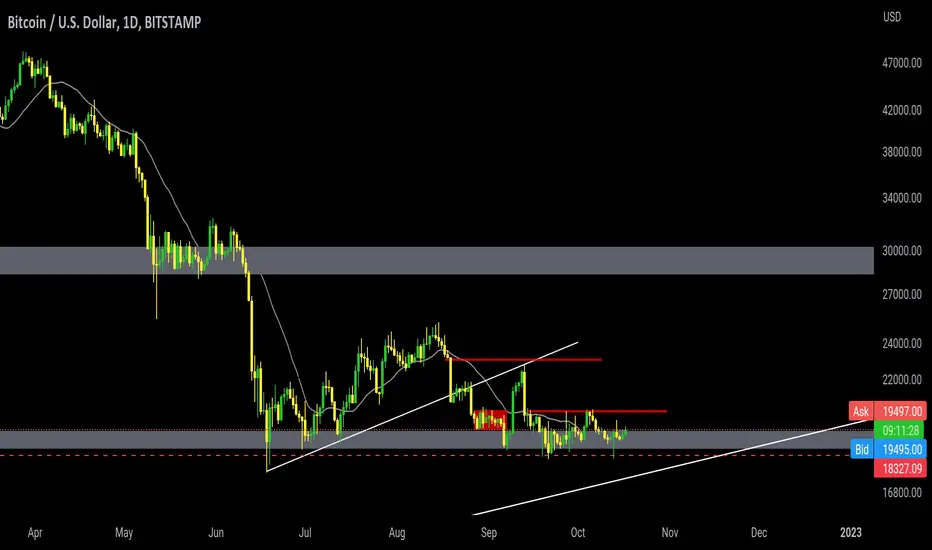
What can be seen in the chart, apart from the discussion of fundamentals, we are at the end of leg 2, and leg 2 overlaps with the break-even level, and these chats that occurred at the end of the trend can most likely be an extension Gap.
In general, this correction can be considered a pullback at the breakeven level (19,000).
But for more believers, it is possible to wait for the breakout trading range that has been specified. or looking for signal bars with good gap
The next reason is to approach the long-term trend line of the chart.

관련 발행물
면책사항
해당 정보와 게시물은 금융, 투자, 트레이딩 또는 기타 유형의 조언이나 권장 사항으로 간주되지 않으며, 트레이딩뷰에서 제공하거나 보증하는 것이 아닙니다. 자세한 내용은 이용 약관을 참조하세요.
관련 발행물
면책사항
해당 정보와 게시물은 금융, 투자, 트레이딩 또는 기타 유형의 조언이나 권장 사항으로 간주되지 않으며, 트레이딩뷰에서 제공하거나 보증하는 것이 아닙니다. 자세한 내용은 이용 약관을 참조하세요.