
I started this specifically for days like today. This is a way to keep myself engage when I have no idea what is going on with the market. I made a commitment to do my best to make a prediction even when I didn't have much to go off. Just keep that in mind!
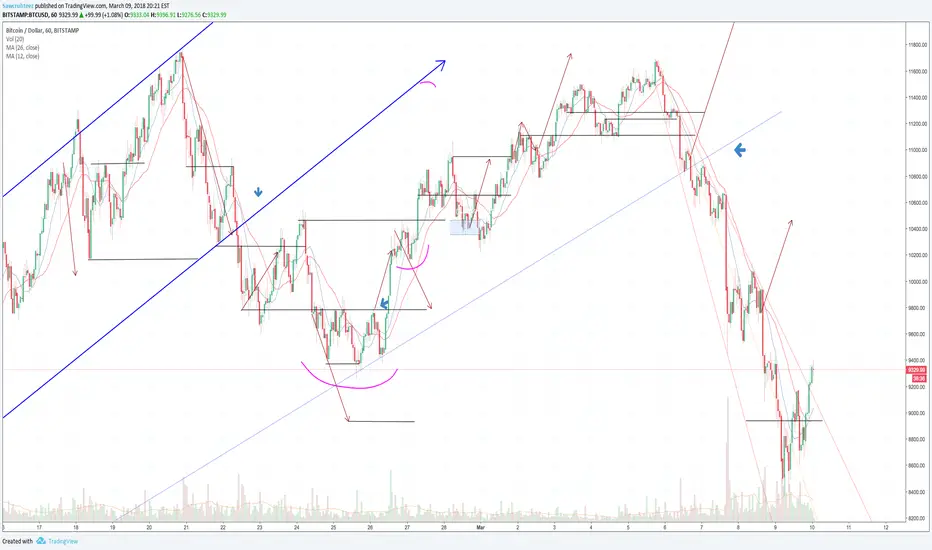
Yesterday I was looking at a diamond bottom forming and went long at $9,800. That was quickly stopped out and I turned fully bearish once we dipped below $8,000. I drew some preliminary trend lines for the bears (dotted red) that I was keeping an eye on. After golfing today I was very happy to see that the bulls pushed the price through the upper level of that trend. We are now testing horizontal resistance.
This is not a spot to go long...sell resistance and buy support! On the other hand I also wouldn't short this rally either. We are looking at a double bottom, then a higher low, followed by a higher high. The 12 & 26 EMA's appear to be crossing right now. That is important because it is the default on GDAX and seems to be what a lot of traders use.
My prediction is a quick rally to $10,000 and then we range over the weekend from $9,400 - $10,000.
I am no longer bearish and have shifted to neutral. I will be sitting on the sidelines until I can be more confident one way or another.
Happy Trading!
Yesterday I was looking at a diamond bottom forming and went long at $9,800. That was quickly stopped out and I turned fully bearish once we dipped below $8,000. I drew some preliminary trend lines for the bears (dotted red) that I was keeping an eye on. After golfing today I was very happy to see that the bulls pushed the price through the upper level of that trend. We are now testing horizontal resistance.
This is not a spot to go long...sell resistance and buy support! On the other hand I also wouldn't short this rally either. We are looking at a double bottom, then a higher low, followed by a higher high. The 12 & 26 EMA's appear to be crossing right now. That is important because it is the default on GDAX and seems to be what a lot of traders use.
My prediction is a quick rally to $10,000 and then we range over the weekend from $9,400 - $10,000.
I am no longer bearish and have shifted to neutral. I will be sitting on the sidelines until I can be more confident one way or another.
Happy Trading!

emasar Indicator is available for purchase at alphanalysis.io/product/emasar/
면책사항
해당 정보와 게시물은 금융, 투자, 트레이딩 또는 기타 유형의 조언이나 권장 사항으로 간주되지 않으며, 트레이딩뷰에서 제공하거나 보증하는 것이 아닙니다. 자세한 내용은 이용 약관을 참조하세요.
emasar Indicator is available for purchase at alphanalysis.io/product/emasar/
면책사항
해당 정보와 게시물은 금융, 투자, 트레이딩 또는 기타 유형의 조언이나 권장 사항으로 간주되지 않으며, 트레이딩뷰에서 제공하거나 보증하는 것이 아닙니다. 자세한 내용은 이용 약관을 참조하세요.